Overview
Welcome to the eighth article of the 3x3 series – Confluence for Designers looking at the communication structure for medium and large organisations to achieve transparency, which leads to frictionless and smooth design delivery.
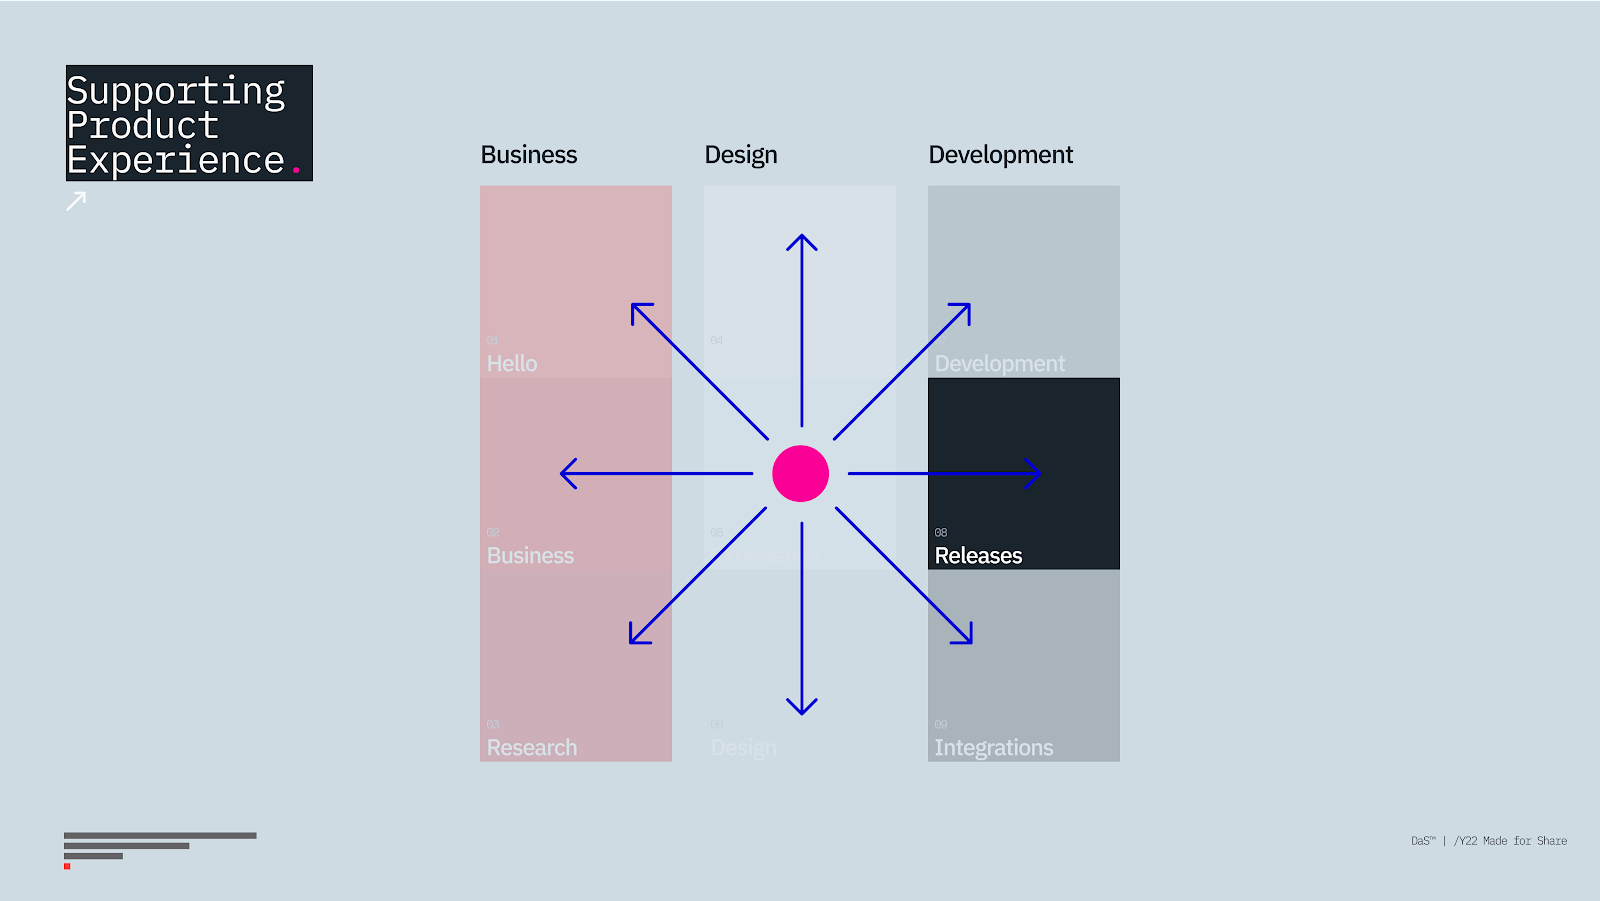
This article will be addressing the trsnaprency within the team as well as outside by automating everything we have just discussed and in previous secions – Hello [001↘︎], Business [002↘︎], Research [003↘︎], Content [003↘︎], Experience [004↘︎], Design [005↘︎] and Development [006↘︎] sections combine here in Release [007↘︎].
To recognise here is to see this all as writing the right story; according to HBR’s [008↘︎] Leadership Legacy book [009↘︎], Robert Galford[010↘︎] and Regina Fazio Maruca provide a disciplined approach to framing the legacy by focusing on right actions as well as shaping it over time. Instead of hunting the deliverables, goals and deadlines to the point of crisis, Your Leadership Legacy enables you as leaders to craft your work and build the legacy under the premise of group experience rather than personal satisfaction.
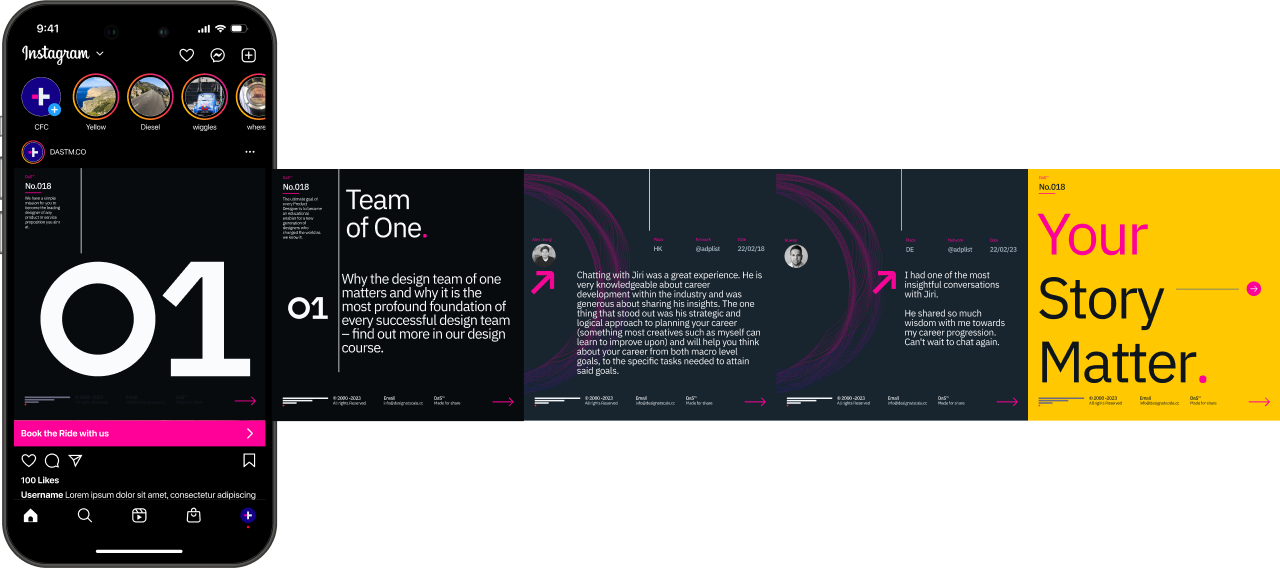
The Release Section focuses on the transparency, community, ain inclusivity of people's terms. It invites everyone to consume, some to react and very few to act – the mental model of the decision-maker, influencer and doer.[011↘︎]

What does the Release Section do?
The primary purpose of this section is to provide an overview for all non-JIRA savvy designers, business people or anyone else outside of the team unit and be able to see and contribute to the course of the outgoing delivery.
Outside of Business and Experience pillars, the essential part of Confluence is the automation and beauty of intertwined, co-related pieces that create a holistic overview.
Looking at the 17 years of my history with Atlassian for the first six years, this section did not exist. I was reporting above, but I do not need to communicate elsewhere.
With an increasing need for performance monitoring in JIRA, and incapability (or no need of control) of some members, this section becomes a monitoring hub for all releases. For less mature teams, we created a single destination that unifies the ultimate picture in the most digestible ways possible. (Upside; no one has to visit JIRA anymore – that was a revolution for some stakeholders)
Rather than communicating different boards and search parameters, We created the Release hun that contained the pages like MVP, Alpha, Beta, CR1.0, CR2.0, etc., where each release has a list of Epic and User stories in the form of a list. For a couple of years, this has been an imported excel table to Confluence. Still, now it’s an interactive, well-intagrated part of JIRA populated specific way so that observers can see only what is related to specific releases.
Each version (less complicated in the beginning and more complicated in the end) has a defined structure to help observers navigate and act on things in their remits. Instead, everybody is trying to do everything.
Structure:
/ YYMMDD MVP Release
/ YYMMDD Alpha Release
/ YYMMDD Beta Release
/ YYMMDD CR1.0 Release
/ YYMMDD CR2.0 Release
/ HLR
/ Release
/ Bugs
/ Resources
/ Budget
/YYMMDD CRX.X Release
The structure above represents each release and substructure part of the specific release.
HLR – I tend to include the page with HLRs for two specific reasons. A/ simple copy and paste for any stakeholders who might interact with the team, and B/ easy to track the original assumption and agreements against the reality.
Release – is a script looking at the specific release through which we can display Backlog, Planned, In Progress, and Done.
(For more complex release solutions, please DM me)
Bugs – having bugs on a separate page allows anyone to see the challenges in a straightforward overview as the dashboard instead of looking for them in between different tickets. This allows the designers to see what needs fixing in the design world and what needs to be fixed in the dev world. Very practical page, especially prior to release.
Resources – mostly applicable for bigger teams as I’m seeing different budgeting and resource software where everything is here in JIRA + Confluence. Reporting at a glance of how much time we have and how much time is calculated for the delivery dictates the resource needed it.
Budget – as with any work, we need to understand how much we burn and what we deliver. Velocity diagrams are good, but I found burn charts even more practical, especially advising StartUps.
As a caveat, once the release is closed (fullfiles DOD and all QA) pushed live, we reprioritise the following disclaimer and optimise for the next significant drop. This allows designers and developers to add what we have missed in terms of monitoring and adjusting the view for specific stakeholders. Finally, the page with all blockers simply highlights the obvious–what needs to get fixed before the release.

The Dev. Section Does not include.
Apart from the obvious, which is static information and form of documents that are not in any form related to the delivery, this section has no downside. As its fully automated, it either exists or not.
The only thing that could go wrong is that someone with admin right changes the JQL [012↘︎] script and jeopardises the algorithm that sorts the search parameter. Other than that, all data are driven by the JIRA. If people correctly move their tickets from ToDo to In Progress and Done, nothing affects the outcome.
For more information, please join the Design at Scale™ Courses that explain the function, impact, and common pitfalls that can be avoided while implementing the DaS™ in your business.
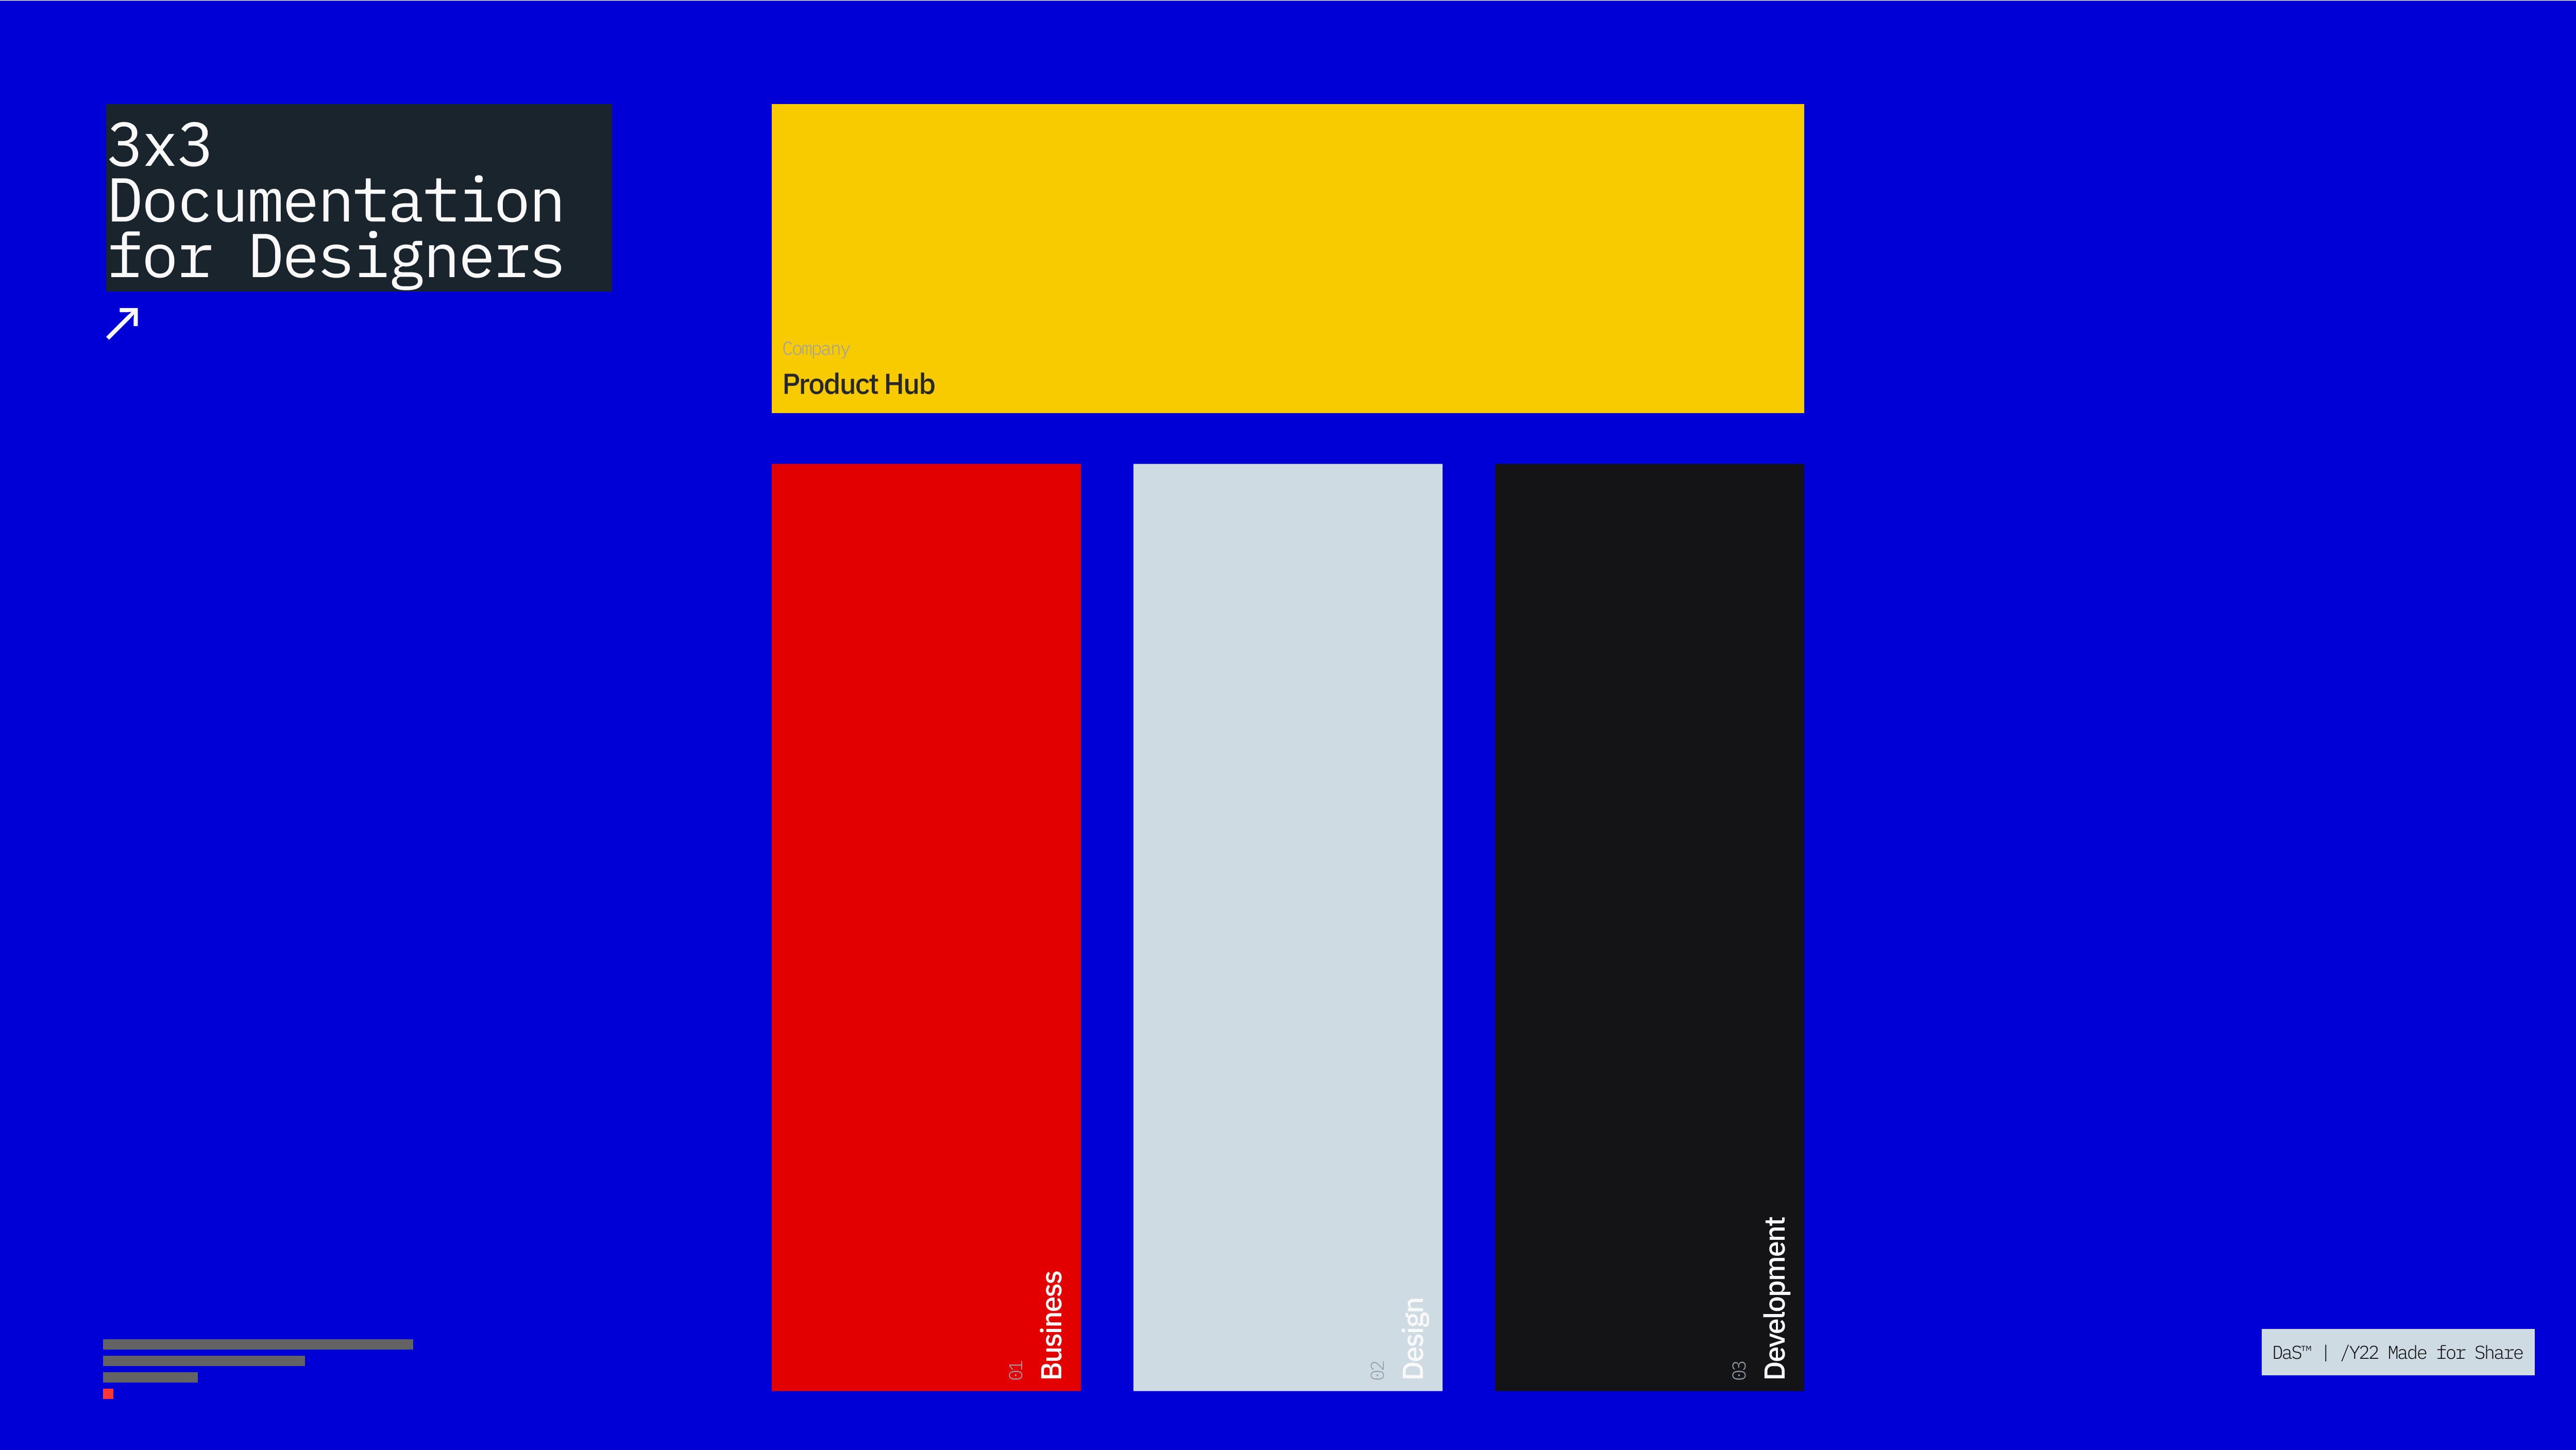
Structure
Let’s look at the Confluence structure in detail:
Business
1.0 — BRAND* Hello 2.0 — BRAND* Business 3.0 — BRAND* Research
Design
4.0 — BRAND* Content5.0 — BRAND* Experience
6.0 — BRAND* Design
Development
7.0 — BRAND* Development
8.0 — BRAND* Releases
9.0 — BRAND* Integrations
I hope you’ve enjoyed the fourth article from 3x3 – Confluence for Designers. Please contact me at @designatscaletm to discuss this implantation in detail if you have any questions. The next article will focus on the Content section and all information related integration of the copy function in this method. See you there.