Welcome back.
In summary, my last article described the tools and methods of implementing basic Dual-Track Agile from the design perspective. We discovered the relationship between the essential elements and the roles they play in Product Design Delivery (PDD in short).
This article will bring us closer to the practical and hands-on approach to be applied daily, plus how designers can better understand JIRA in relation to their work.
“We are far better connected since 1984, yet we still spend, on average, 62% of our time logging in, downloading, uploading, versioning or finding the right medium of communication than we do on actual creation.” — Experience Design Director, Greenwich.
Given the nature of remote team management, clarity and immediate access give us a significant advantage over teams that struggle with chatter and clarifying meetings.
Planning
The majority of project planning still happens without considering all disciplines. Whether it is due to timing, budget, resources or simply just the nature of the business — this very first step highlights the most significant misalignments in our teams.
“As a designer, our fiduciary responsibility is to understand what we are doing next and its impact on the entire proposition.”
We need to appreciate how our decisions are tied together in front of the user; we must understand the end-to-end journey. Some CPOs and CSMs still keep designers in the dark when it comes to negotiations.
It’s your time to read everything you have access to and ask the questions. We often find that design is not scope because no one knows how many tasks need to be fulfilled. Designers must be part of any planning meetings. If that’s not possible, they MUST look at the amount of work and assess the deliverables to understand the tasks ahead.
Design Questions:
- What, When and Why are you working on this specific release?
(Use Confluence to document what you’ve discovered to your benefits that can be shared with others.) - What is the design function of this release?
(Supportive, Peripheral, Integrated or Central) - Who owns the design delivery?
(Usually, it’s the Design Lead, if not, ask around who is the next design representative — if no one it’s luckily you.)
Release
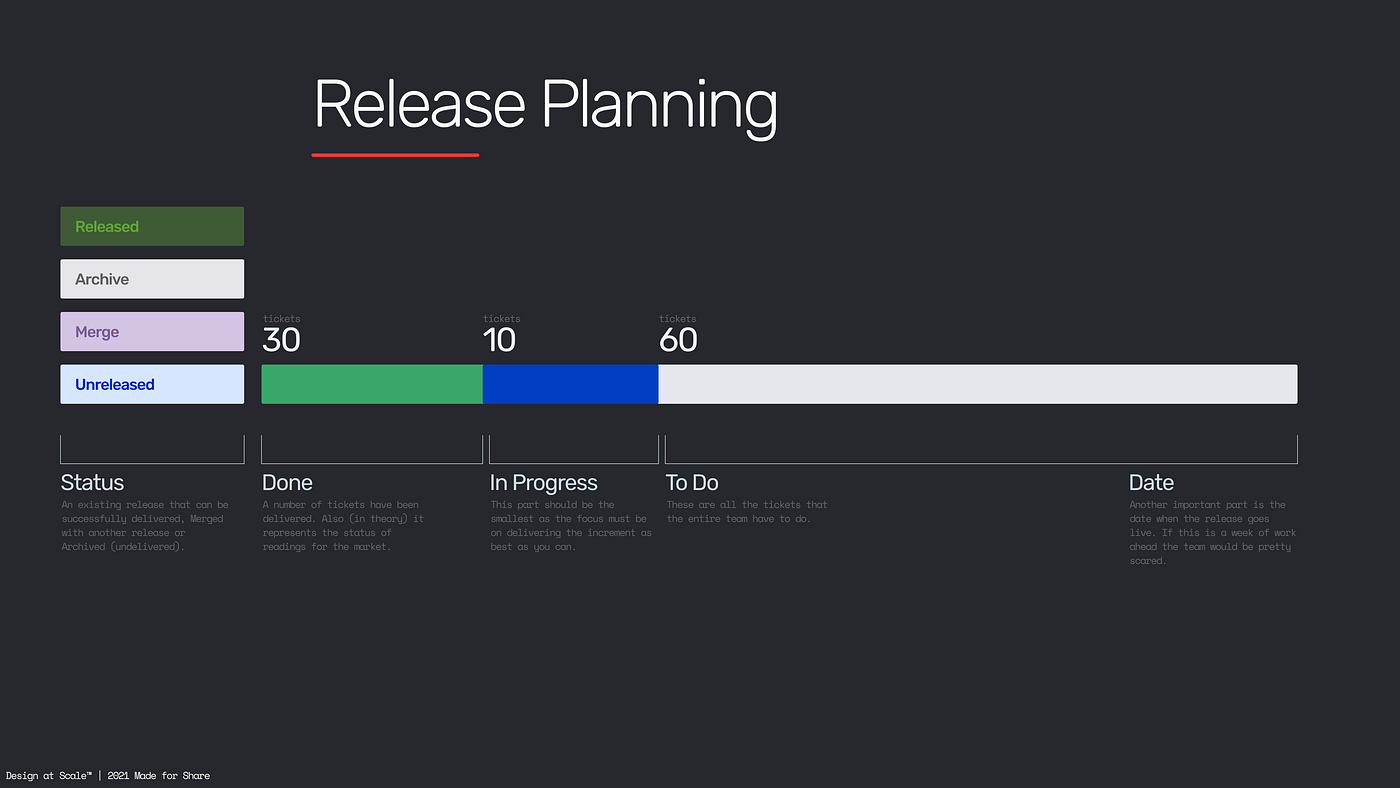
Releases represent points in time for our project. It’s a scheduled gate of features that are due to be rolled out to our customers. It’s a way to organise our work. With Jira, we can define what’s to be done on any particular day. Jira allows us to define releases and see if we’re on target to achieve our goal — https://www.atlassian.com/agile/tutorials/versions.
In the figure above — green represents the task that has been done (delivered), the blue colour represents the task in progress (now working), and grey is the one that wasn’t planned or delivered yet. This gives everyone a quick picture of where a project is at any moment. You could go even deeper to see how many design tasks have been done and how many remain.
Design Questions:
- Which of the following Epics, User Stories, Tasks are mandatory for this release?
(Even if you end up in 12+ Sprint, CPO must know the question of what needs to be designed E2E — End to End.) - What are the MUST HAVE deliverables expected from the design function?
(Create a simple list of all deliverables like Experience Map, User Journey, Behavioural Model, Wireframe etc. and use the MoSCoW method to prioritise it.) - Get ready and prepare yourself a Design Road Map, then validate it with your CPO and CSM. Ask what you need me to do?
(Anything missing can be negotiated at this point — if not later, it will be on your side to burn much more time than others as they will expect to have answers.)
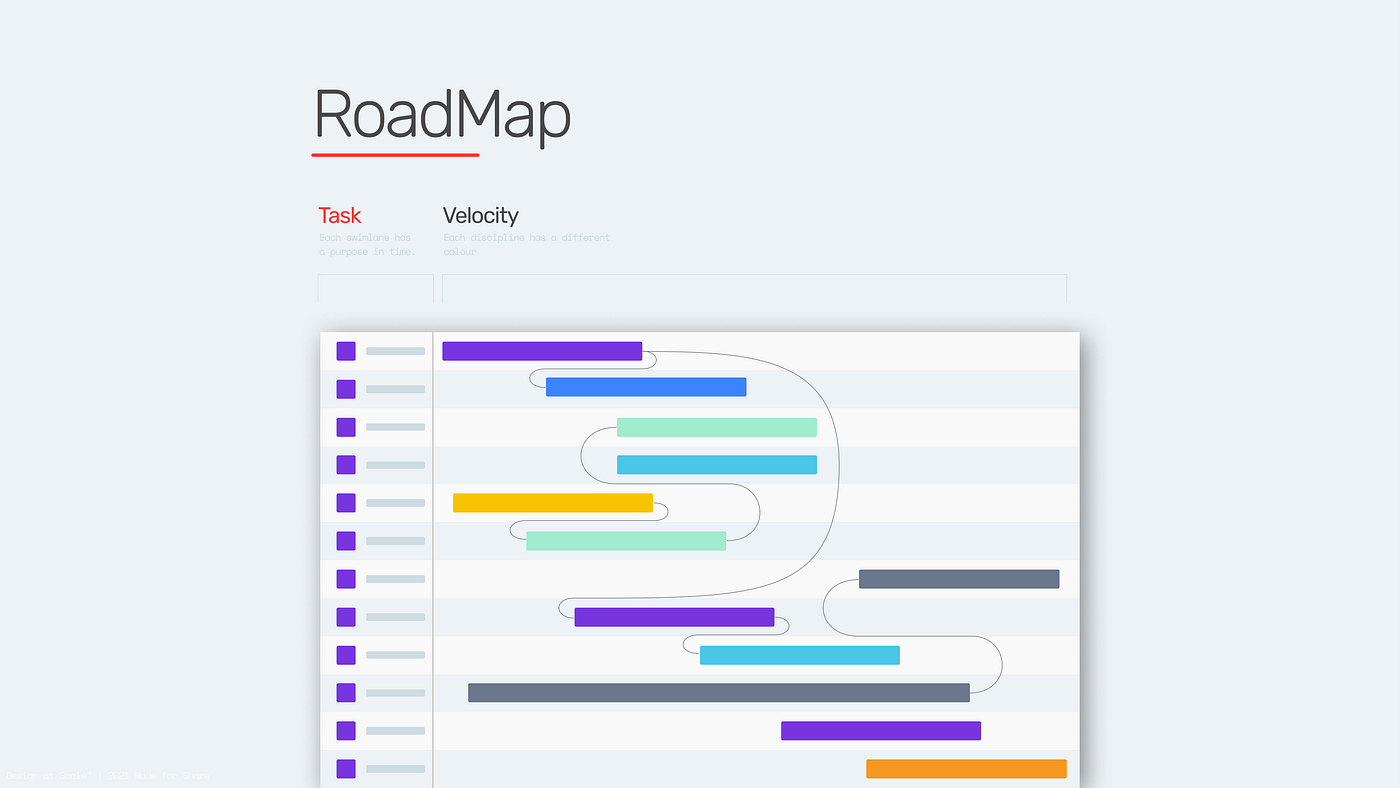
Velocity
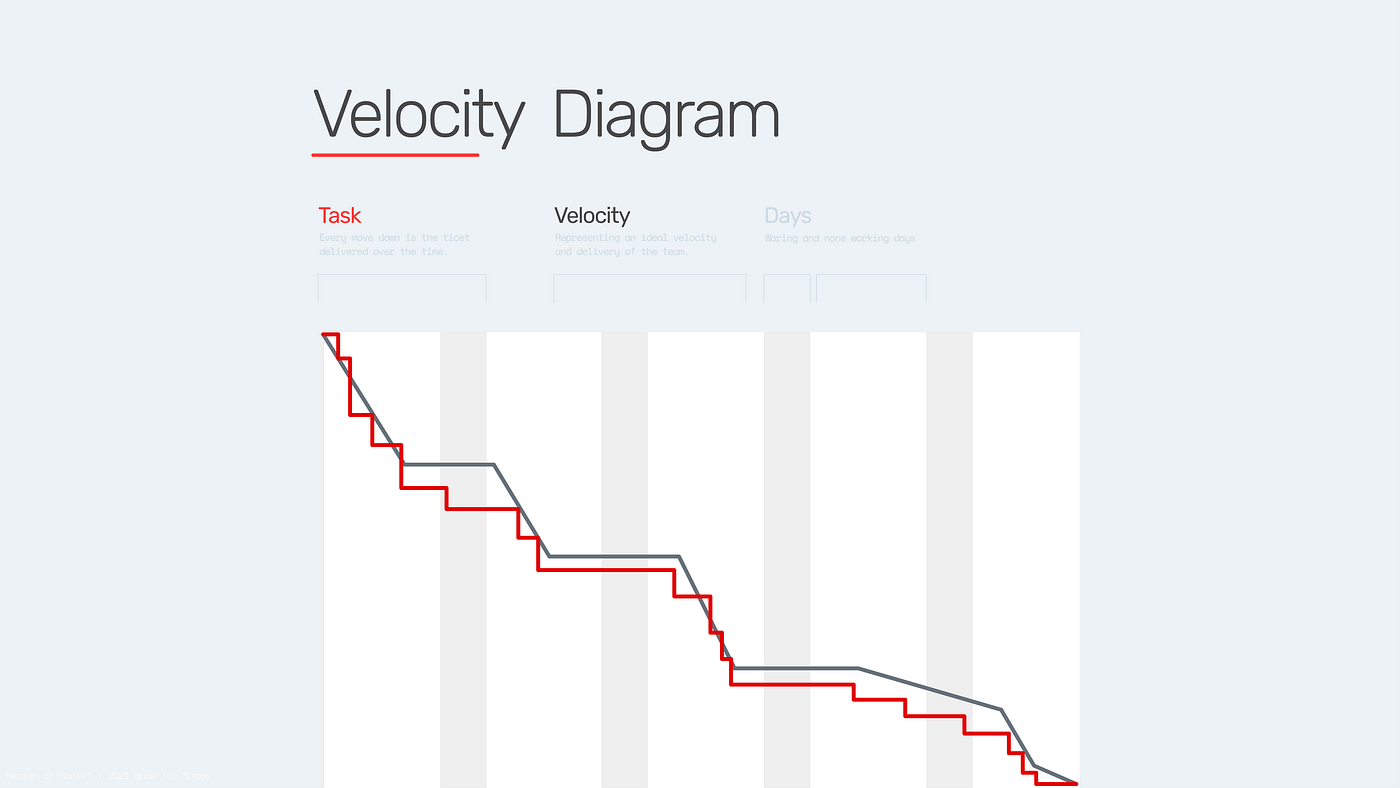
“The velocity chart displays the average amount of work a scrum team completes during a sprint. Teams can use velocity to predict how quickly they can work through the backlog because the report tracks the forecasted and completed work over several sprints. The more sprints, the more accurate the forecast.” — Source: Atlassian Support
Now, what does this mean to a Designer?
Suppose you are staring at a velocity diagram that means nothing to you. With a little bit of observation and some digging, you’ll find out how your team receives and reacts to design change.
Let’s say you know that your team has been waiting for a site map or data model you need to contribute to. The velocity goes down because of the dependency on design. For a designer, this is the point of negotiation of additional time or resources to create and validate the site map, so it can not be delivered in the same sprint.
Design Question:
- If our CPO overestimates the time for design, we are good. We can deliver high-quality deliverables, and the team is happy.
- If our CPO underestimates, we need to know how to negotiate more time for the task. The question here is quality over quantity?
(Some teams rush the decision and tend to underestimate the value of documenting success or failure — which eventually leads to losing the transparency and clarity) - Ask the developer or CSM how you can improve the velocity?
(Or if it is even necessary to them)
Complexity
The complexity around the proposition rises mainly due to the clarity of communicated information. The majority of features can be usually described as the “if this, then that” scenario (developers, please forgive me for the brutal simplification here). This is where communication becomes more subtle, seldomly selected, and from time to time ambiguous.
Excluding the team of teams (Scrum@Scrum) scenarios, the average group has its challenges whether we talk about the dynamics, communication, technical challenges. Designers should use weekly retros to elevate the transparency and, if that does not work, add extra tickets that represent clarifying the specific problem.
“One important thing — if you uncover something (or anything at all), please — document it.” — Experience Design Director, Greenwich
Your colleagues will appreciate it. More importantly, as a designer, you have a significant advantage to create graphs, charts, maps that simplify the complexity — the environment is yours, knock yourself out — make it pretty, make it on-brand!
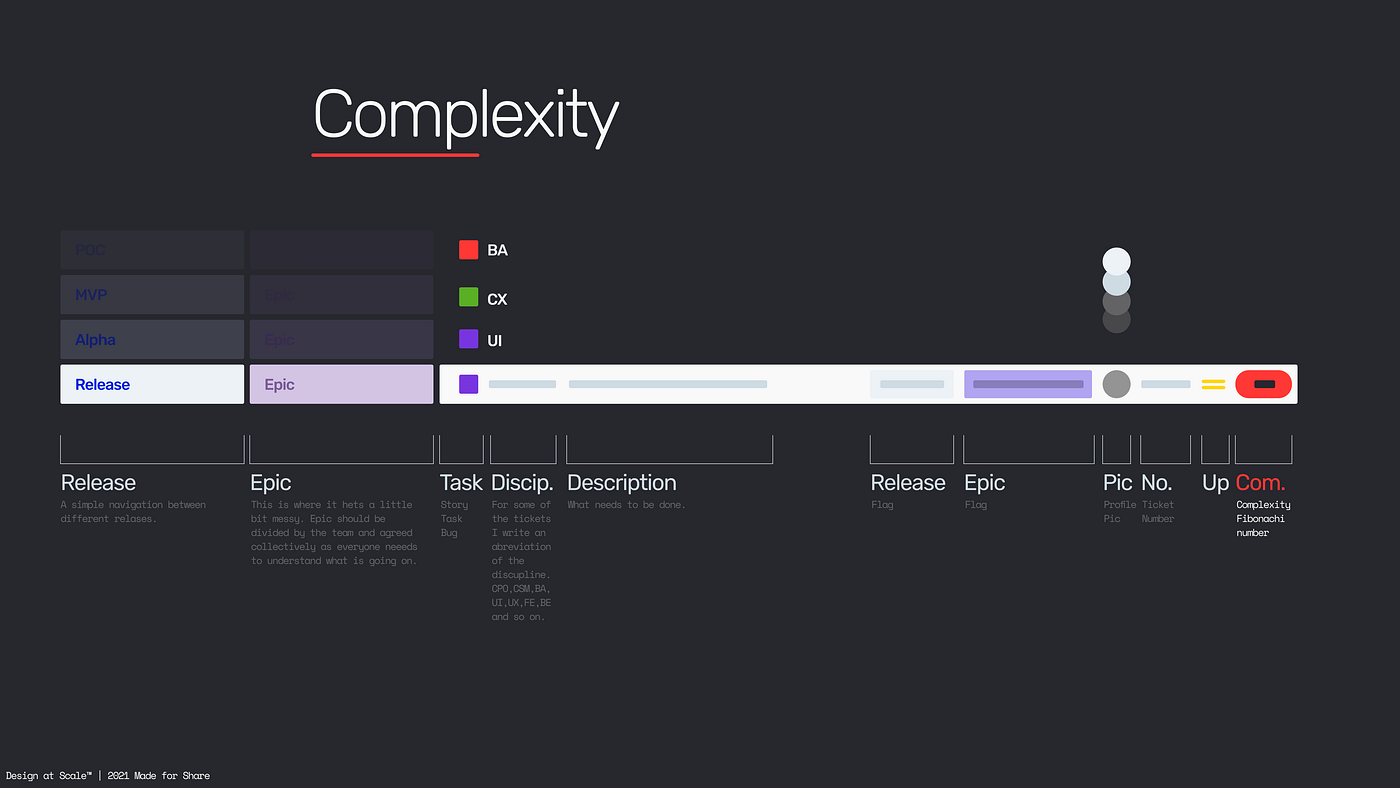
The last two points are very important for my teams. A/ We use the Fibonacci number (1,2,3,5,8,13,21 …) to clarify the complexity of the task in the form of story points. (Super practical and helpful). And B/ I advise all designers to contribute to adequate development tickets with design questions and vice versa developers on design tickets. The impact of the influencer vs doer roles is explained in a previous article.
Design Questions:
- What drives the complexity?
(business, people, technology etc.) - Who will benefit from the transparency?
(business, design, development etc.) - Complexity = Opportunity for Service Design.
(Helping others to recognise the pain points, document them on the experience map that is constantly reviewed on Retro.)
Flexibility
The majority of the product management team discuss “time to market” as the essential thing in PDD. The teams that have been highly successful have one key characteristic — flexibility. This goes hand-in-hand with prioritising and planning, as well as the quality of the design deliverables that could reduce code refactoring.
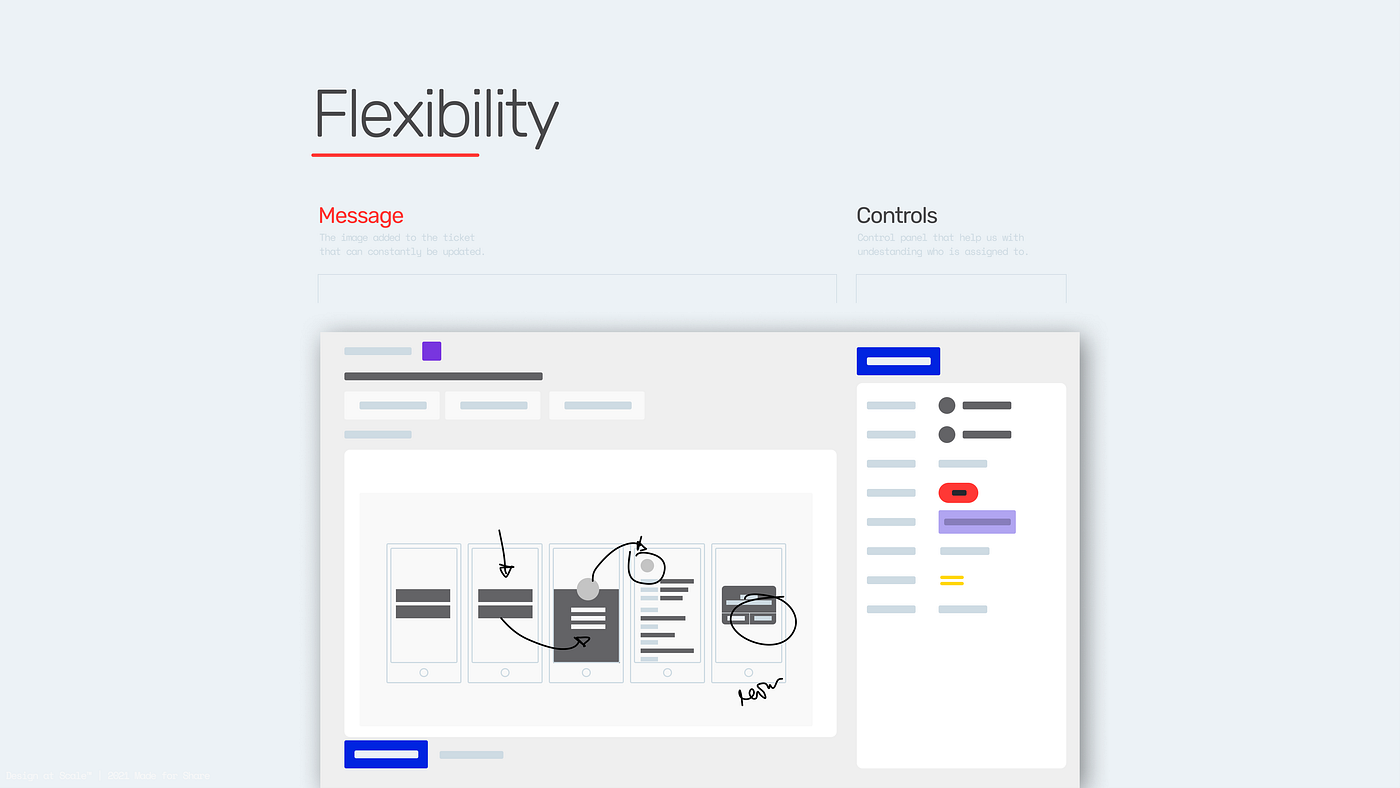
I usually create a ticket and add the drawing or print-screen (JIRA example in the figure above) of what has been discussed and what we want to achieve. That allows me to manage the expectations of others. Meanwhile, it represents “the next best thing” (an increment) that helps us to progress further — without mentioning that all my teammates know that these tickets were updated, and they are part of the conversation.
Investing the time in “oversharing” creates the connection of the redistributed ownership. And if all understand the above-mentioned concept, then the sharing had a massive impact on the overall understanding.
Here’s an example. Starting as a senior designer on a project that had 27 different features, I started documenting everything in Confluence and linking all my findings to the appropriate tickets in JIRA. Soon, developers and CPOs & CSMs started asking me to add more to the structure and create more diagrams simplifying the complexity of the proposition. By the end of month 8, I was leading all 27 features from an Experience Design Perspective and delivering them as one single ecosystem.
Design Questions:
- How do I share everything with my developers?
(I have set up 20+ teams with Figma + JIRA and diminish the “where-is” question from our vocabulary.) - How do I communicate changes in CX and UI are define DoD?
(Things nowadays update automatically, every day, I spend 5–10 min at 5 PM to update all my active JIRA tickets — allowing my teammates to see all relevant information before their next-day tasks.) - When change comes, create tangible outcomes from the very first meeting, “drawing on the napkin if you wish,” and upload it to JIRA.
(Simply share the drawing as an agreement of the discussed task and approximate time you need for the delivery, 5 hours perhaps.)
Dependencies
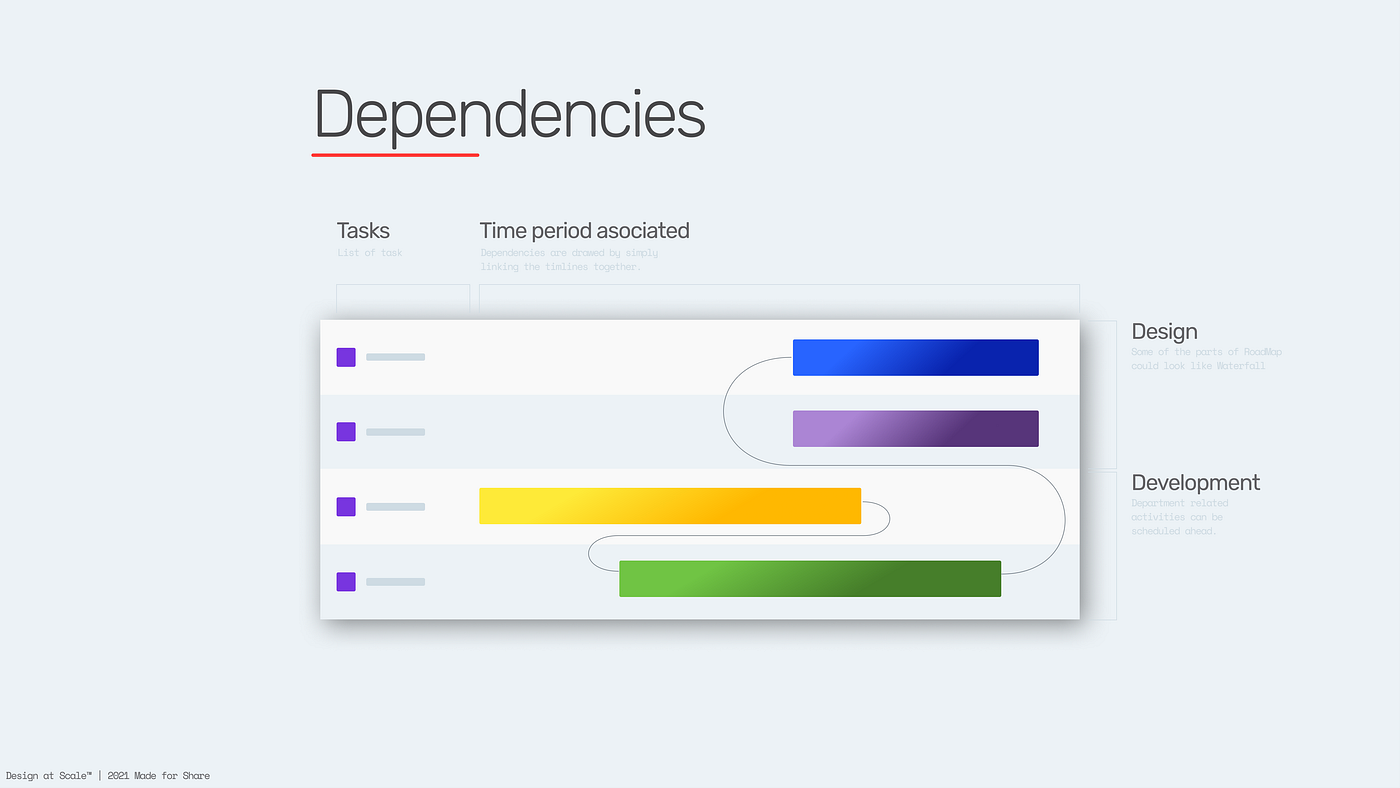
Whatever we design, it does not live in a silo. Draw the dependency diagram and present it to your CPO (Branding, Marketing, Design System, wireframes, you name it). Only after that should you drill into the details — we usually save 20–30% of the time and prepare the business for inevitable investment in quality.
I mentored one junior designer from Seville, Spain. He openly expressed his frustration at being pushed to define the typeface for an app where the brand and marketing activity was running in parallel (and wasn’t even in the first iteration).
We discussed a simple yet very effective and quick approach to building a flexible design system rather than focusing on details in the app. So, when the change and the defined brand proposition came, this meant he could update it with little or no effort, even across 30–300 pages and almost 30,000 elements.
Helping to bring the design dependency diagram to CPO, you’ll quickly communicate dependencies of what needs to be done, how long it takes and what impact on overall delivery it will have.
Design Questions:
- How do we track the changes?
(Design changes could be very subtle how and where are you letting your colleagues know something has changed) - How do we label different design iterations within the release?
(By the Sprint, by a version of Design System, by your key, etc.) - Who do you assign these updates to?
(Back to CPO or your design Lead)
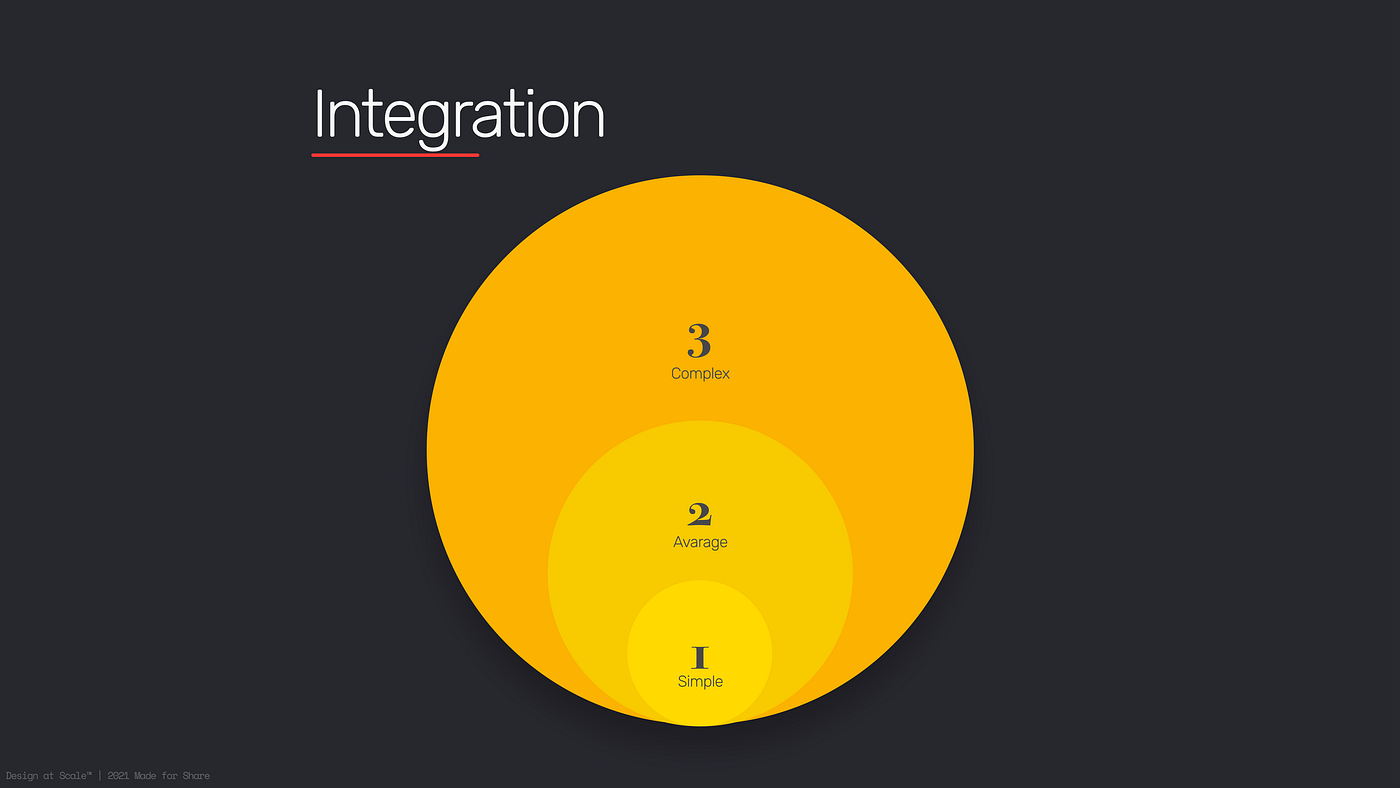
Integration
Okay, so let’s suppose we’ve finally accomplished a huge goal. Our feature/product is out; now it’s time to find out how our customers like it. Assuming we have done our diligence and tested the feature correctly several times and all the findings and decisions correctly recorded.
The first week and the backlog is full of bugs and design changes that will take time to implement. Using the above Complexity, Flexibility and Dependencies, we can unblock pretty much anything.
Yet, the design itself could be a blocker. Maybe a user arrives from a different service where “the navigation pattern” was different? Or perhaps they need to copy a phone number from an app that has the disabled function “selected”. The possibilities are endless.
We could help to write a specific design-related backlog with our CPO or CSM to define some quick wins. They were practical and helped us to keep moving. On a complexity scale, 1–2–3 (simple 1D — average 3–5D — complex 10+D) define what you can do for the team to avoid “it’s a simple to copy and paste” — allowing you to review changes that impact your proposition.
Design Questions:
- To begin with, ask the CPO where the product or service will be integrated so that you understand the behavioural dependencies. Then ask for a considered time to research them.
- With that knowledge, engage with the team and ask for attention, not a meeting to present and contribute to the same course. Open this topic as early as you can — it will allow you (and your team) to be in a much better position to integrate.
- If you unwillingly reach the point of 700+ design bugs, and all need to be solved ASAP — make sure you and at least one more senior design member is part of the clustering and planning the way forward. Everyone is a designer, and design by committee is, unfortunately, an inevitable outcome.
References
Atlassian — https://www.atlassian.com/agile
Product Wold — https://productworld.co/
Product led Wold — https://productledworld.com/
Science Direct — https://www.sciencedirect.com/
Now we’ve reached the point where we understand the basics and know what the product world expects from designers in an Agile-based delivery. The very next article will focus on design specific disciplines integrated with peripheral or centralised Agile teams.