This is how designers diagnose what needs fixing inside an organisation.
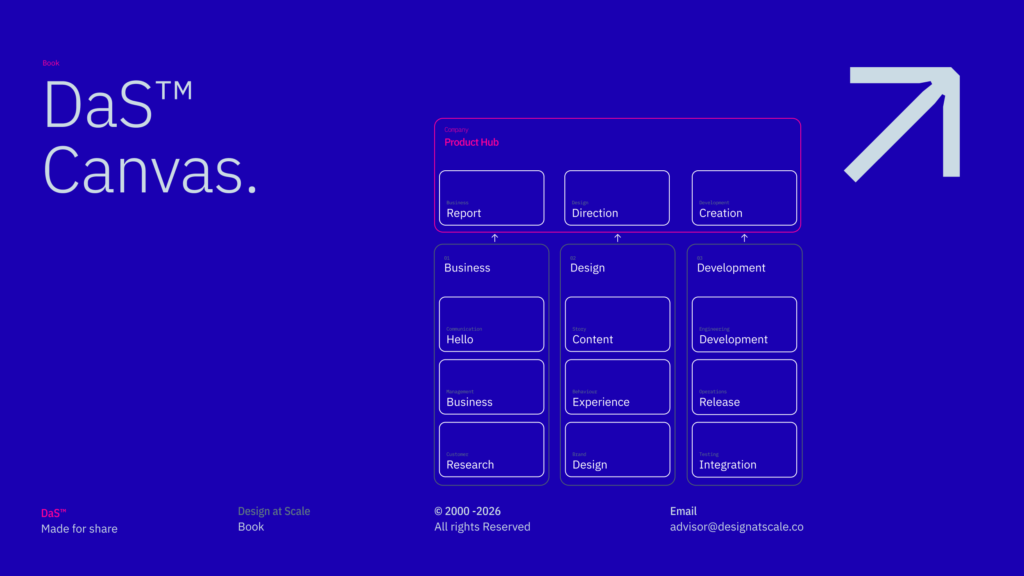
The Experience Map (DaS™ Canvas) translates the previous framework into a practical, decision-making tool. Its purpose is simple: to help designers ask better questions, surface hidden gaps, and understand what must change for an organisation to scale design effectively.
Modern organisations are flooded with theories, principles, and methodologies — many useful, many conflicting. Without a shared lens, teams fall back on legacy habits: “We’ve always done it this way.” That mindset slows progress, erodes morale, and diminishes ROI. The Experience Map offers a way out by helping teams select the methods that interrelate, reinforce each other, and produce meaningful outcomes.
Scepticism around new frameworks is natural — especially when past attempts have produced inconsistent results. But a method's value depends on clarity: What problem does it solve? What assumptions sit beneath it? And why might an alternative approach matter more in this context?
Every discipline brings its own logic. Business optimises value. Development optimises feasibility. Design bridges the two - turning strategic intent into human-centred outcomes, articulating trade-offs, and making technology understandable and usable. When design scales well, it becomes the connective tissue that accelerates delivery rather than slowing it.
Within the organisation, three core swimlanes operate together: Business, Design, and Development. Each has its own responsibilities, pressures, and expectations. The DaS™ Canvas maps these swimlanes side-by-side, revealing where alignment holds and where breakdowns occur. It makes clarity visible.
The canvas prompts leaders and teams to ask the essential questions:
— Where are we heading?
— What do we need to deliver today, this week, this quarter?
— What does each discipline require to do its best work?
— Which gaps in knowledge, ownership, or process slow us down?
— How do we create transparency across the entire delivery unit?
Used consistently, the Experience Map shifts teams from reactive behaviour to intentional, coordinated delivery. It acts as both diagnosis and direction - a way to understand where you are, and a shared blueprint for where you need to go next.
| Com | Team | Tech | Ops | |
| Business | What business communicates where and how? What form of communication has been proven to be effective? What communication had a greater (or poor) impact on the team? | How does the business create, maintain and measure the performance of the team in relation to outputs/ outcomes? How are the teams assembled, and who trains them to act as one? | How does the business use the technology in order to achieve the objectives necessary for success? What role does automation play in the core of the business? | What role does the operation play in connecting the team and technology in order to achieve better transparency? How does the business redistribute and collect the insights from the business units and satellite teams? |
| Design | How does design communicate (broadcast) the impact on the business and development? How does design help throughout discovery, prototyping, validation, delivery and overall product adoption? | How is the design integrated with your current team, and what role does it have? What type of design team do you build, and how does this team fit into the business strategy? | What technology supports the translation of the strategic vision and constant iteration in the design space? How does technology help to maintain the relevant information without clutter and informational overload? | How does our operation support the sustainable growth model? How do we validate the best communication, design or development tools for the proposition and how are they implemented alongside other tools? |
| Development | How does development communicate with business and design while making progress and decisions about a solution? Does engineering support the design function and vice versa? | What type of engineering function do you build, and what is your understanding of design integration? How does your engineering team work alongside or with design representatives? Do you employ Creative Technologists? | How well do we translate the design into code? How well do we deal with legacy code/design, and how do we improve the existing code to be always reusable? Do design and development have technology debates, or is the technology decided in silos? | Do we have one location we can track, monitor, assign, comment, track progress, etc.? Or are we relying on all sorts of other tools and features to do the same with extra hassle? |
Figure: Swimlanes
The Experience Map helps your team identify strengths and weaknesses across the organisation. Improving weaker areas is valuable. But improvement alone doesn’t guarantee scalability. Scalability comes from understanding where the gaps are, why they exist, and how they affect the flow of delivery across business, design, and development.
The assessment that follows positions your team within those three swimlanes. It acts as a simple, judgment-free gap analysis. Its purpose is not to assign blame, but to reveal the conditions that either accelerate or slow down product design delivery.
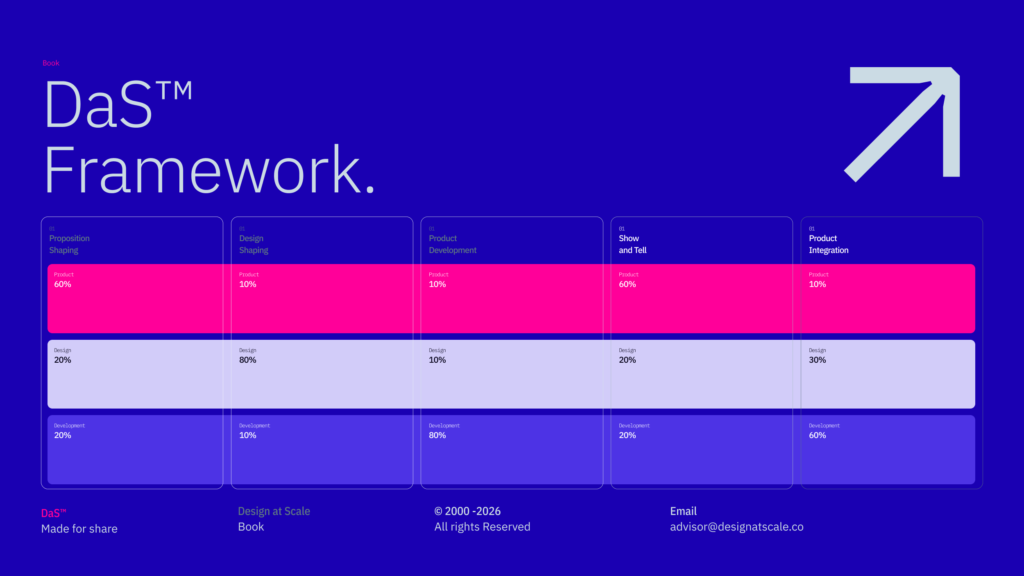
In the next sections, we break down each area - Business, Design, and Development - and explain how the Design at Scale™ framework supports delivery, clarifies expectations, and guides teams toward an ideal operating state.
Business
Method
For centuries, businesses have relied on milestone-based progress - the “stage and gate” model. Each gate marks a decision point where leaders assess progress, evaluate risks, and decide whether to move forward. What matters is not just the work between the gates, but the quality, clarity, and actionability of what is reviewed at each checkpoint.
In DaS™, these gates evolve into a more rigorous system. Assumptions are identified early, tracked, and added to a working backlog. This backlog is prioritised by business impact, customer value, operational constraints, and strategic urgency. Each review becomes an opportunity to refine direction and reduce ambiguity, ensuring accountability across all levels of the organisation.
Self-managed teams accelerate this process. They make daily incremental decisions, resolve issues quickly, and increase ownership of outcomes. Managers shift from task supervisors to enablers of progress - clearing obstacles, reinforcing vision, and communicating the wider strategy. Instead of micro-management, the emphasis moves to precision in communication: vision, reason and impact.
Outputs
Typical business outputs include strategy decks, business plans, budget tracking, quarterly spend reports, operational forecasts, and resourcing plans. These are often dispersed across Word, Excel, PowerPoint, and shared folders. Much of this becomes administrative waste.
DaS™ replaces this with a single structured knowledge base.
Source of truth: Figma
Knowledge: Confluence (or a wiki of choice)
Action: Jira
This unified ecosystem reduces noise and ensures every update, decision, and dependency is visible in real time. The team speaks “one language” in one place, enabling decisions that previously took days to happen in seconds.
Outcome
The primary business outcome is transparency of the proposition - end-to-end clarity on what is being built, why, by whom, and when.
DaS™ provides visibility across the entire delivery chain:
— Leaders see progress and risks early
— Testing teams understand the impact of strategy changes
— Designers and engineers align on behaviour, not aesthetics
— Dependencies become explicit, not accidental
By removing silos and enabling cross-functional understanding, DaS™ dramatically improves time-to-market, decision quality, and organisational confidence.
Design
Method
DaS™ integrates design directly into business and development, providing a structured method that organises and elevates traditional design practices rather than replacing them. Over decades, organisations have moved through Waterfall, Double Diamond, Lean UX, Service Design, Design Thinking, Design Sprint, and research-led approaches. Each brings strengths, but none solve the underlying issue: consistency.
DaS™ brings coherence. It ensures designers work within a clear operating model where:
exploration has boundaries
iteration has purpose
outputs build toward measurable outcomes
shared knowledge replaces personal preference
creativity is supported, not scattered
It respects craft but removes inefficiency. It protects creative time but prevents design by committee. And in distributed teams, it provides structure where distance creates drift.
Outputs
Design outputs - prototypes, UI components, patterns, typography, layout systems - are widely understood. What’s often invisible is the conceptual work beneath them: behavioural models, navigational logic, mental models, content systems, data structures, and interaction rules.
DaS™ treats every artifact as part of an integrated system. Typography, colour, spacing, ratios, assets, and interaction patterns evolve through:
— exploration
— iteration
— testing
— tokenisation
— implementation
Changes flow through the design system and redistribute across the UI instantly. Instead of refactoring pages, teams refine tokens, which propagate everywhere. Across 40+ properties, this creates an efficient, modular, scalable system.
Outcome
Design drives revenue when it delivers the right experience to the right customer with the right behavioural outcome. DaS™ positions design not as the driver, not as the passenger, but as the connective tissue linking business ambition to development execution.
With DaS™, organisations have repeatedly:
— reduced operational cost by 25–30%
— accelerated delivery by 3–5× (and 7–10× with automation)
— improved decision quality through shared systems
Not through shortcuts. But through integrated, human-led, transparent practice.
Development
Methods
DaS™ integrates seamlessly with Agile delivery - development, management, testing, and release. The goal is to support iterative creativity through a role that bridges design and engineering: the Creative Technologist (XT).
XT engineers validate assumptions early, run rapid experiments, and build functional prototypes in code while designers prototype in Figma. This dual path removes friction and prevents waste.
DaS™ works in any environment:
— agency or in-house
— product-led or culture-led
— 10-person startup or 150+-person department
Time-to-handover collapses. Collaboration strengthens. Delivery accelerates.
Outputs
Design produces prototypes; XT produces the same behaviour in code.
Together, this dual output:
— cuts code waste by up to 40%
— validates feasibility early
— resolves behavioural and interaction risks
— aligns engineering before development begins
All validated artifacts - prototypes, flows, tokens, components - are synced across Figma, the code repository, and Confluence. This ensures reuse, clarity, and rapid iteration.
Outcome
DaS™ removes design debt and technical debt before they accumulate.
Once both sides validate the approach, the XT transforms the test codebase into a release-ready version. The Solution Architect and Senior Engineer then define the technical direction, allowing the engineering team to scale the build efficiently.
By week 12 on one major programme, DaS™ enabled:
— weekly feature releases to live environments
— a parallel “experimentation product” for rapid testing
— designers and developers merging into a single team of “makers”
This is the DaS™ advantage: continuous adaptation, deep integration, and measurable acceleration.
Knowledge becomes a system, not an individual skill. Curiosity replaces hierarchy. Learning becomes operational, not inspirational.