We’ve all been there. Someone, most probably a boss, asks us to find the latest email or Miro [001↘︎] board or simply share a file created a while ago, and we struggle to find it.
Where is it?
How do I find it?
How was it called again?
Perhaps it was <final _final _RobertsFinal _shipping _version _final.ext> doesn’t make sense to anyone who didn’t specifically work on it.
Situations like these are not rare; after observing studies describing different lenses where people struggle to locate their pressure assets in various business functions[002↘︎], I become curious about what techniques can shift this paradigm. And we all one day find what we are looking for?
In other words, how do we navigate within inherited naming conventions or structures?
What other methods can we apply to reach the desired outcomes?
Is the search the ultimate answer to file location? (especially if we do not know what we are looking for)
How can we, as a team, department, or business, choose a scalable approach to the naming convention?
The following four articles aim to set basic principles that help us organise our world of digital assets in whatever structure we find ourselves in. Equally, draw some lines on what to control and what to ignore.
“IDC estimates that an enterprise employing 1,000 knowledge workers wastes at least $2.5 - 3.5 million per year searching for information, failing to find existing actionable information.” – IDC Survey (2020)
To understand the challenge better, we need to rewind a few centuries to understand the basis and implications of how we all got here.

History of bookkeeping
Luca Pacioli [004↘︎], the Italian father of accounting, is the first to mention double-entries in bookkeeping and complex naming structures. He introduced a new structure for identifying, recording, and archiving the item for future reference.
As accountancy evolved over the centuries, single books became books of books, and information grew with a need for another approach to filing complex things. More than the record itself, this was about the mental model [005↘︎] of how complex accounts were recorded and inevitably linked together to track the obvious – the monetary value of subjects.

Alphabets and Numbers
Using numbers became the easiest way to sort things out and give order. (1, 2, 3 and so on, where 1.1 defined the substructure of 1.0). [006↘︎]
Early alphabet systems enhanced the naming convention with 0-9 and A-Z combinations. This allowed us to scale and have more complex numbered systems. Consider health records in the early 20th Century. People signed boxes with the letter A and dividers with Aa, Ab, Ac, Ad, and so on[007↘︎]. Some letter-based filing systems[008↘︎] still exist and deliver value to small GP practices worldwide.

Cards and Boxes
The physical experience of cards and boxes evolves onto the digital filing system. A progressive mental model allows the observer to navigate complex data structures[009↘︎]. This impacts how we see the data and recall information from our available data sources.
When we need to control someone's data we haven't created, DropBox, One Drive, and Google Drive become increasingly difficult to use. Things can lead to 12 versions of the Friday PPTX stakeholder presentation scattered over 12 different drives, including a cloud drive copy in Slack and Miro. Let’s not forget Teams[010↘︎], either. We just need a link to a server where we can all contribute.
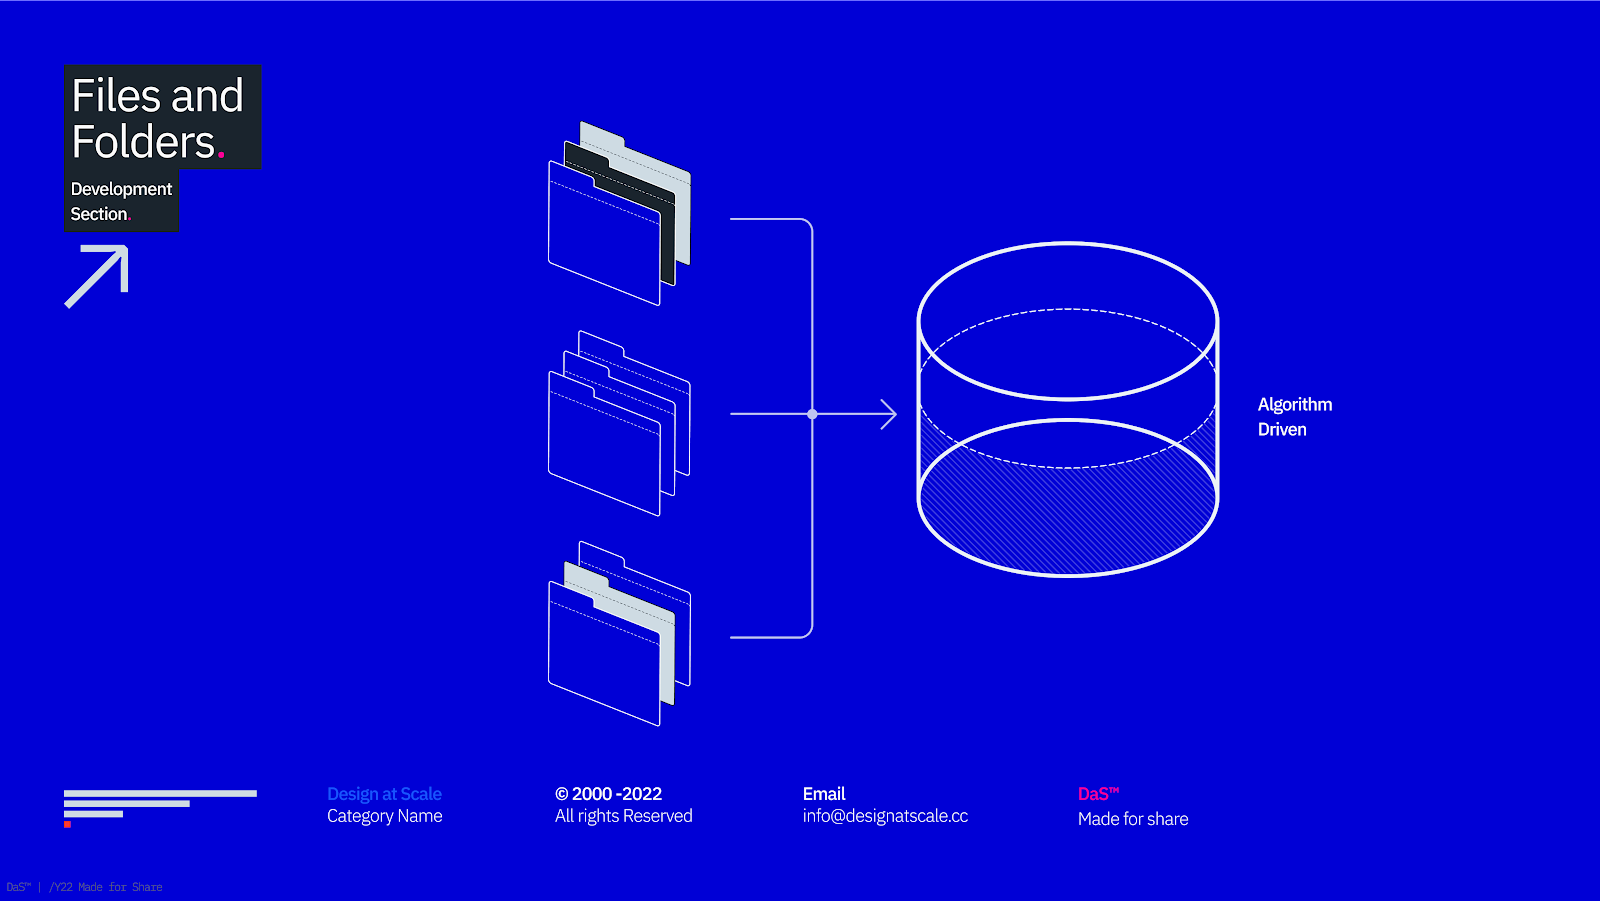
Files and Folders
I’ve experimented with thousands of structural models for labelling and maintaining directories. Those findings have been shared and challenged with businesses large and small (agencies and in-house) to find an optimal way to address physical and mental structures.
“Don’t use this file; we haven’t merged it yet as there are some changes from the previous design system that we haven’t cleaned up!” – Senior Designer, Banking Institution, UK 2022
The agency usually has PMs who decide, above anything else, the file structure and the rest of the team follows. As a designer, you remember to add whatever you create into folder 05. Design – and the rest did not matter. Unfortunately, our Sketch[011↘︎] and Figma[012↘︎] files are no longer on the local drive; they are also in Cloud[013↘︎], Abstract[014↘︎], and who knows where else.
Arriving at a design team of 50+ people in business units serving three propositions might be a particular challenge where no one owns or updates the design system. And in particular, where no one looks after naming conventions.
Environment
That brings us to the final point: a mental model that can be applied across folders, file layers, and even your email.
The method is called 3x3 [015↘︎], which describes human pathways and how we focus on and sort information under pressure.
We create three “3” mental areas (before, during, after). We used to have folders like IN, WORK, and OUT at the agency. The continuous incremental delivery and versioning challenged that structure ultimately.
The mental model stayed the same. We still have “before” (research and analysis). We all know the “during” (often translated as the process). And “after” (release and outputs), where we aim to achieve specific outcomes.
Where next
The above is not rocket science: As a genuine note to all readers, try to look at your current folder structure and ask yourself the following questions:
1/ Where does my data live?
– one or multiple locations?
– if multiple, why is it?
– is it necessary or mandatory?
2/Do these places share the same structures?
– If so, can you (or your team) easily navigate?
– If different? (What is the reason behind that)
3/ How much time do you spend organising your data?
– Never (ask yourself how much data you carry that you do not need?)
– Often (how much time you invest and how much time you gain by finding the information quickly)
4/ How much time do you spend looking for the data?
– In your structure
– In someone else's structures
– If different? (why?)
5/ If you were the chief architect of your data, what would you do differently?
– For yourself?
– For others?