Welcome to the sixth article of this series that focuses on designers in the team of one. After diving deep into coms and opening the decision pathways for the technology, we should now look at how all these pillars are tied together.
This article aims to focus on the fundamental pillar called design operation. Simply put, Design Ops has two parts. First – focus on all things related to pre-production. Second, it focuses on translation (handover) between the business, design, and development that optimises the product design delivery. In other words, what set of tasks needs to be delivered to achieve desired outputs that allow the business to reach measurable outcomes?

Ducks in the row
As with any operational challenge, design operations focus on design integration in the company, which brings the design to the centre of attention, not necessarily in the centre of the business. Some companies (for example, development houses) are focused on releases, and design plays the supportive function, whereas other Advertising agencies and media shops are more focused on designing end-to-end proposals that serve a limited time, instead of releasing regular updates of one product or proposition.
By understanding this difference, you, as a designer, will understand what role the design plays and what aspects are needed to deliver desired outcomes. Let’s paint the picture of you servicing a startup or a company of one. That would mean the following things:

Communication
For starters, you’ll be dealing with multiple communication channels – email, Slack, and different project management tools. The procurement, invoicing, and time sheets will follow that and so on. Having one source of truth will clarify where to look, who to contact, and when. How and who do you report to and when? Once you figure out the basics – make the routine out of it.
Simply – Slack your boss in the morning. Attend to stand up, tell people you work with what you are going to do and when you finish it. Tell them when you deliver (ideally at the end of the day) and share the link (or better, print screen). At the end of the week, update your timesheet and get ready for your weekend.
The question to ask here would be the following:
- Who am I communicating with?
- What am I communicating (design, money, vision, strategy)?
- How often am I communicating?
- What form is the best?
- What does broadcasting mean?
(...and many others want to know more, please book our Academy session)

Design
Let’s say you are a UX-er and paint that picture (for other disciplines, it is the same with the nuance of specific interaction you can find on DaS™ Grid).
How do you own your file structure?
Most likely, you’ll be working on a shared file. Makes little sections and own them. All your work should have – before, during, and after a rationale for why you do what you do. That will soon feed the Managerial part of your inputs.
Good practice for me is to have a morning heads up, “I’m here doing X”.
During the day, update others when necessary.
Yet, at the end of the day. “I have done X”, and here is my rationale why – probably the space for future work or improvements.
All my designs are connected to the image database, icon DS, predict DS, and release DS, organised by the version (on that subject in a separate article soon). This allows my team to reuse all the files I produce the day after I release them. To do so, I need to broadcast that; Otherwise, no one would ever know there is something to reuse.
My work goes to Confluence; you can try Notion or Slack, whatever works for you and your team. The aim here is to let your team know, “Hey, peeps – use my work!”. Those who will contribute will use it and improve it. Those who don’t will know this is happening, and those who are informed can use this information for further reporting.
Each Friday, I spend 1 hour (or less) putting all my work in 3-5 slides' output to represent the outcomes and value I/we created for the business and its customers.
This closes the design week, including the automated update.
The outcome is the following:
- My work has been created.
- My work has been documented and broadcast (and this function is automated)
- My work has a clear gate (stage-gate process from MBA) plus to any PO or PM.
- Finally, there is a trail and recorded hours that are further reused in timesheets and invoicing.

Management
The above clearly addresses internal communication. As designers, we report/communicate to our peers and colleagues. The design ops. is an inevitable part of it. I’ll use Atlassian–Jira as an example (but you can use any equivalent to your defences as long as you deliver results that resemble those of your defences).
Every Monday, I select a set of tickets that are sized up and allocated to my team members. This allows everyone to manage the expectation of what is happening when the work is done, and when it is going to be shipped.
This creates up to 5 tickets per designer in our team. Each one of them describes what they are going to do and when. We link appropriate Figma files to Jira alongside Confluence pages and BitBucket test branches.
Daily, we pick one ticket. Have a brief discussion over the phone or in person about how we will approach it. Then we have 5 hours of production time work (reminder of the 5x50 method). At the end of the day, everyone updates their tickets, and we all have a quick call (if necessary) to live our little lives and rest what matters.

Velocity
All the above creates well-oiled machinery where things get started, delivered and shipped regularly. That also creates momentum for designers/makers to see that all the things they make end up in the hands of developer colleagues and, later on, customers. That created the velocity, and we can now calculate the productivity and its impact on the business, design (understanding, maturity, and integration), development, and regular shipment.

Why it Matters
Why does the above matter? Having your work record, which is tied to your management and procurement billing, is necessary for your communication. Through this daily micro-interaction, you have yourself a weekend each month to go through the timesheet and invoices, telling your boss what value you have created for the business.
Second, you have the backup of your files that makes you ready for the portfolio/case study together for presenting the idea internally. Having said that, it also brings your attention to product owners and engineering colleagues. Inevitably, seeking new avenues and opportunities to connect with other people in the business to share your work.
You essentially become a translator for everyone's (business) needs – take time and practice. However, the result is unprecedented.
Vocabulary
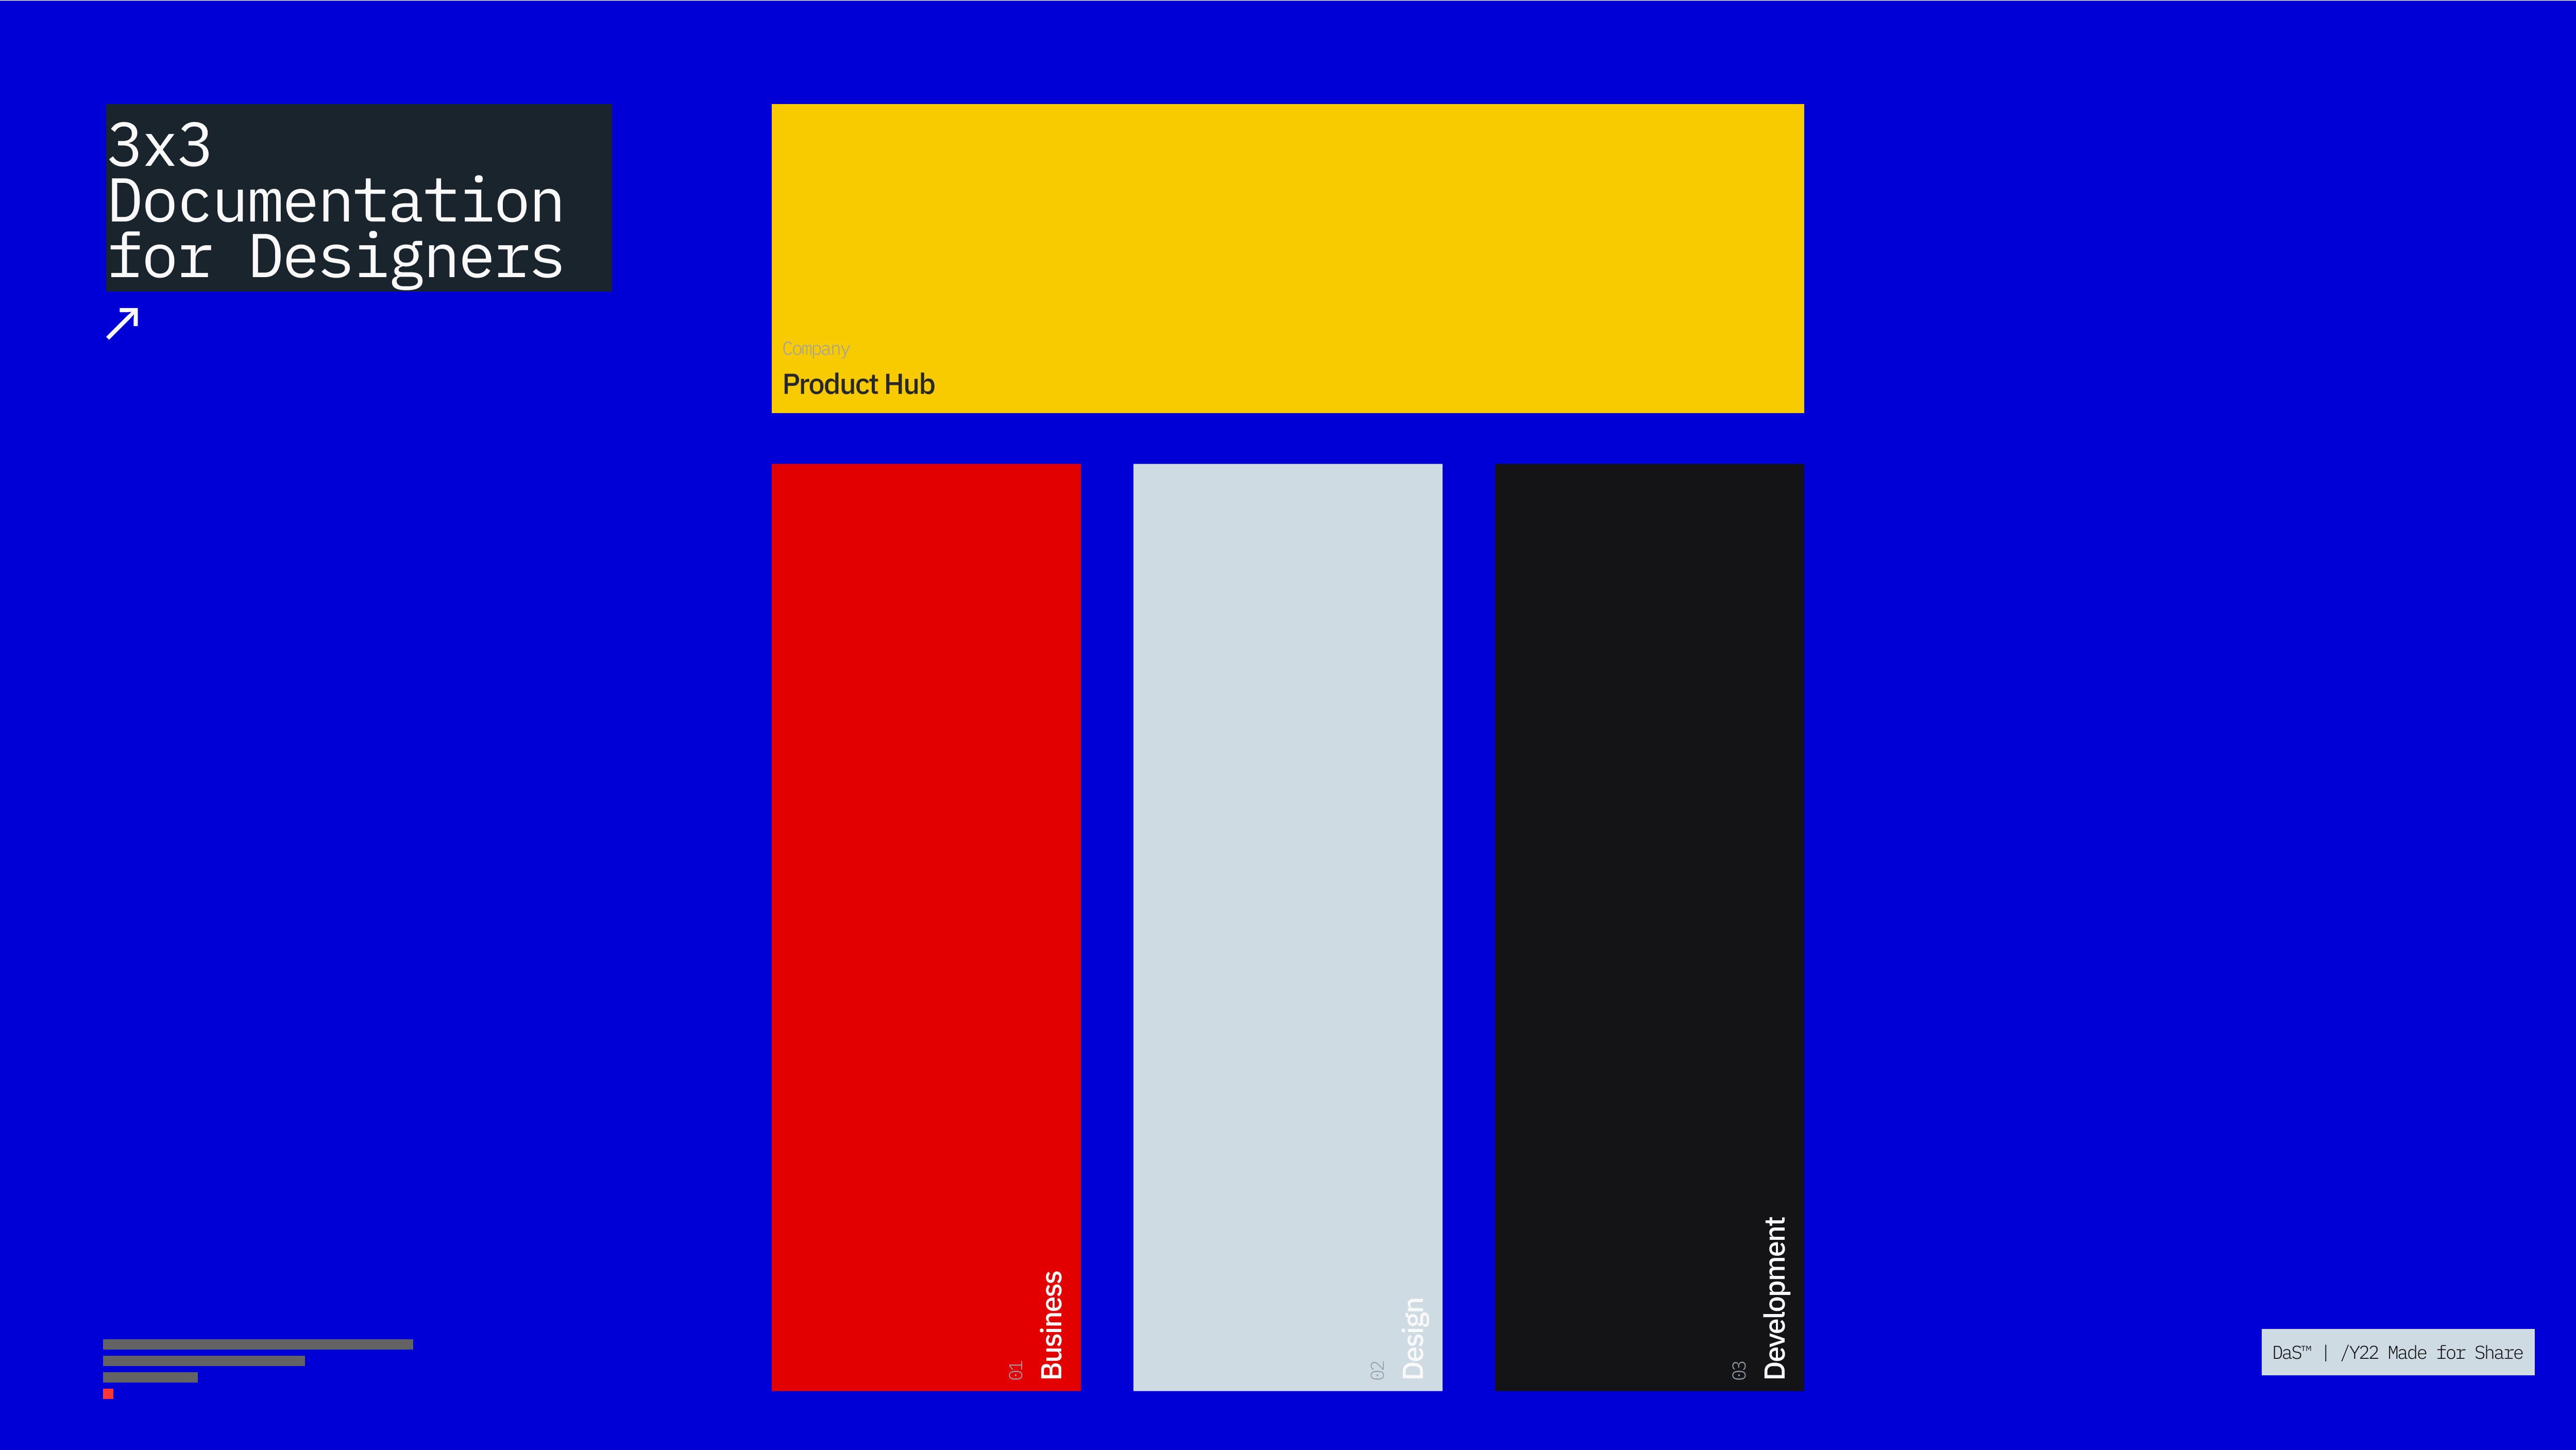
- Company – startup, small business or corporation.
- Business – team of managers that drive the business objectives forward
- Design – design department or function delivering design artefacts to both the business (marketing, vision, strategy) as well as the product/service development team.
- Development – engineering function in the company.
- Integration – integration with other businesses, services or products, usually collaboration of all the above.