Overview
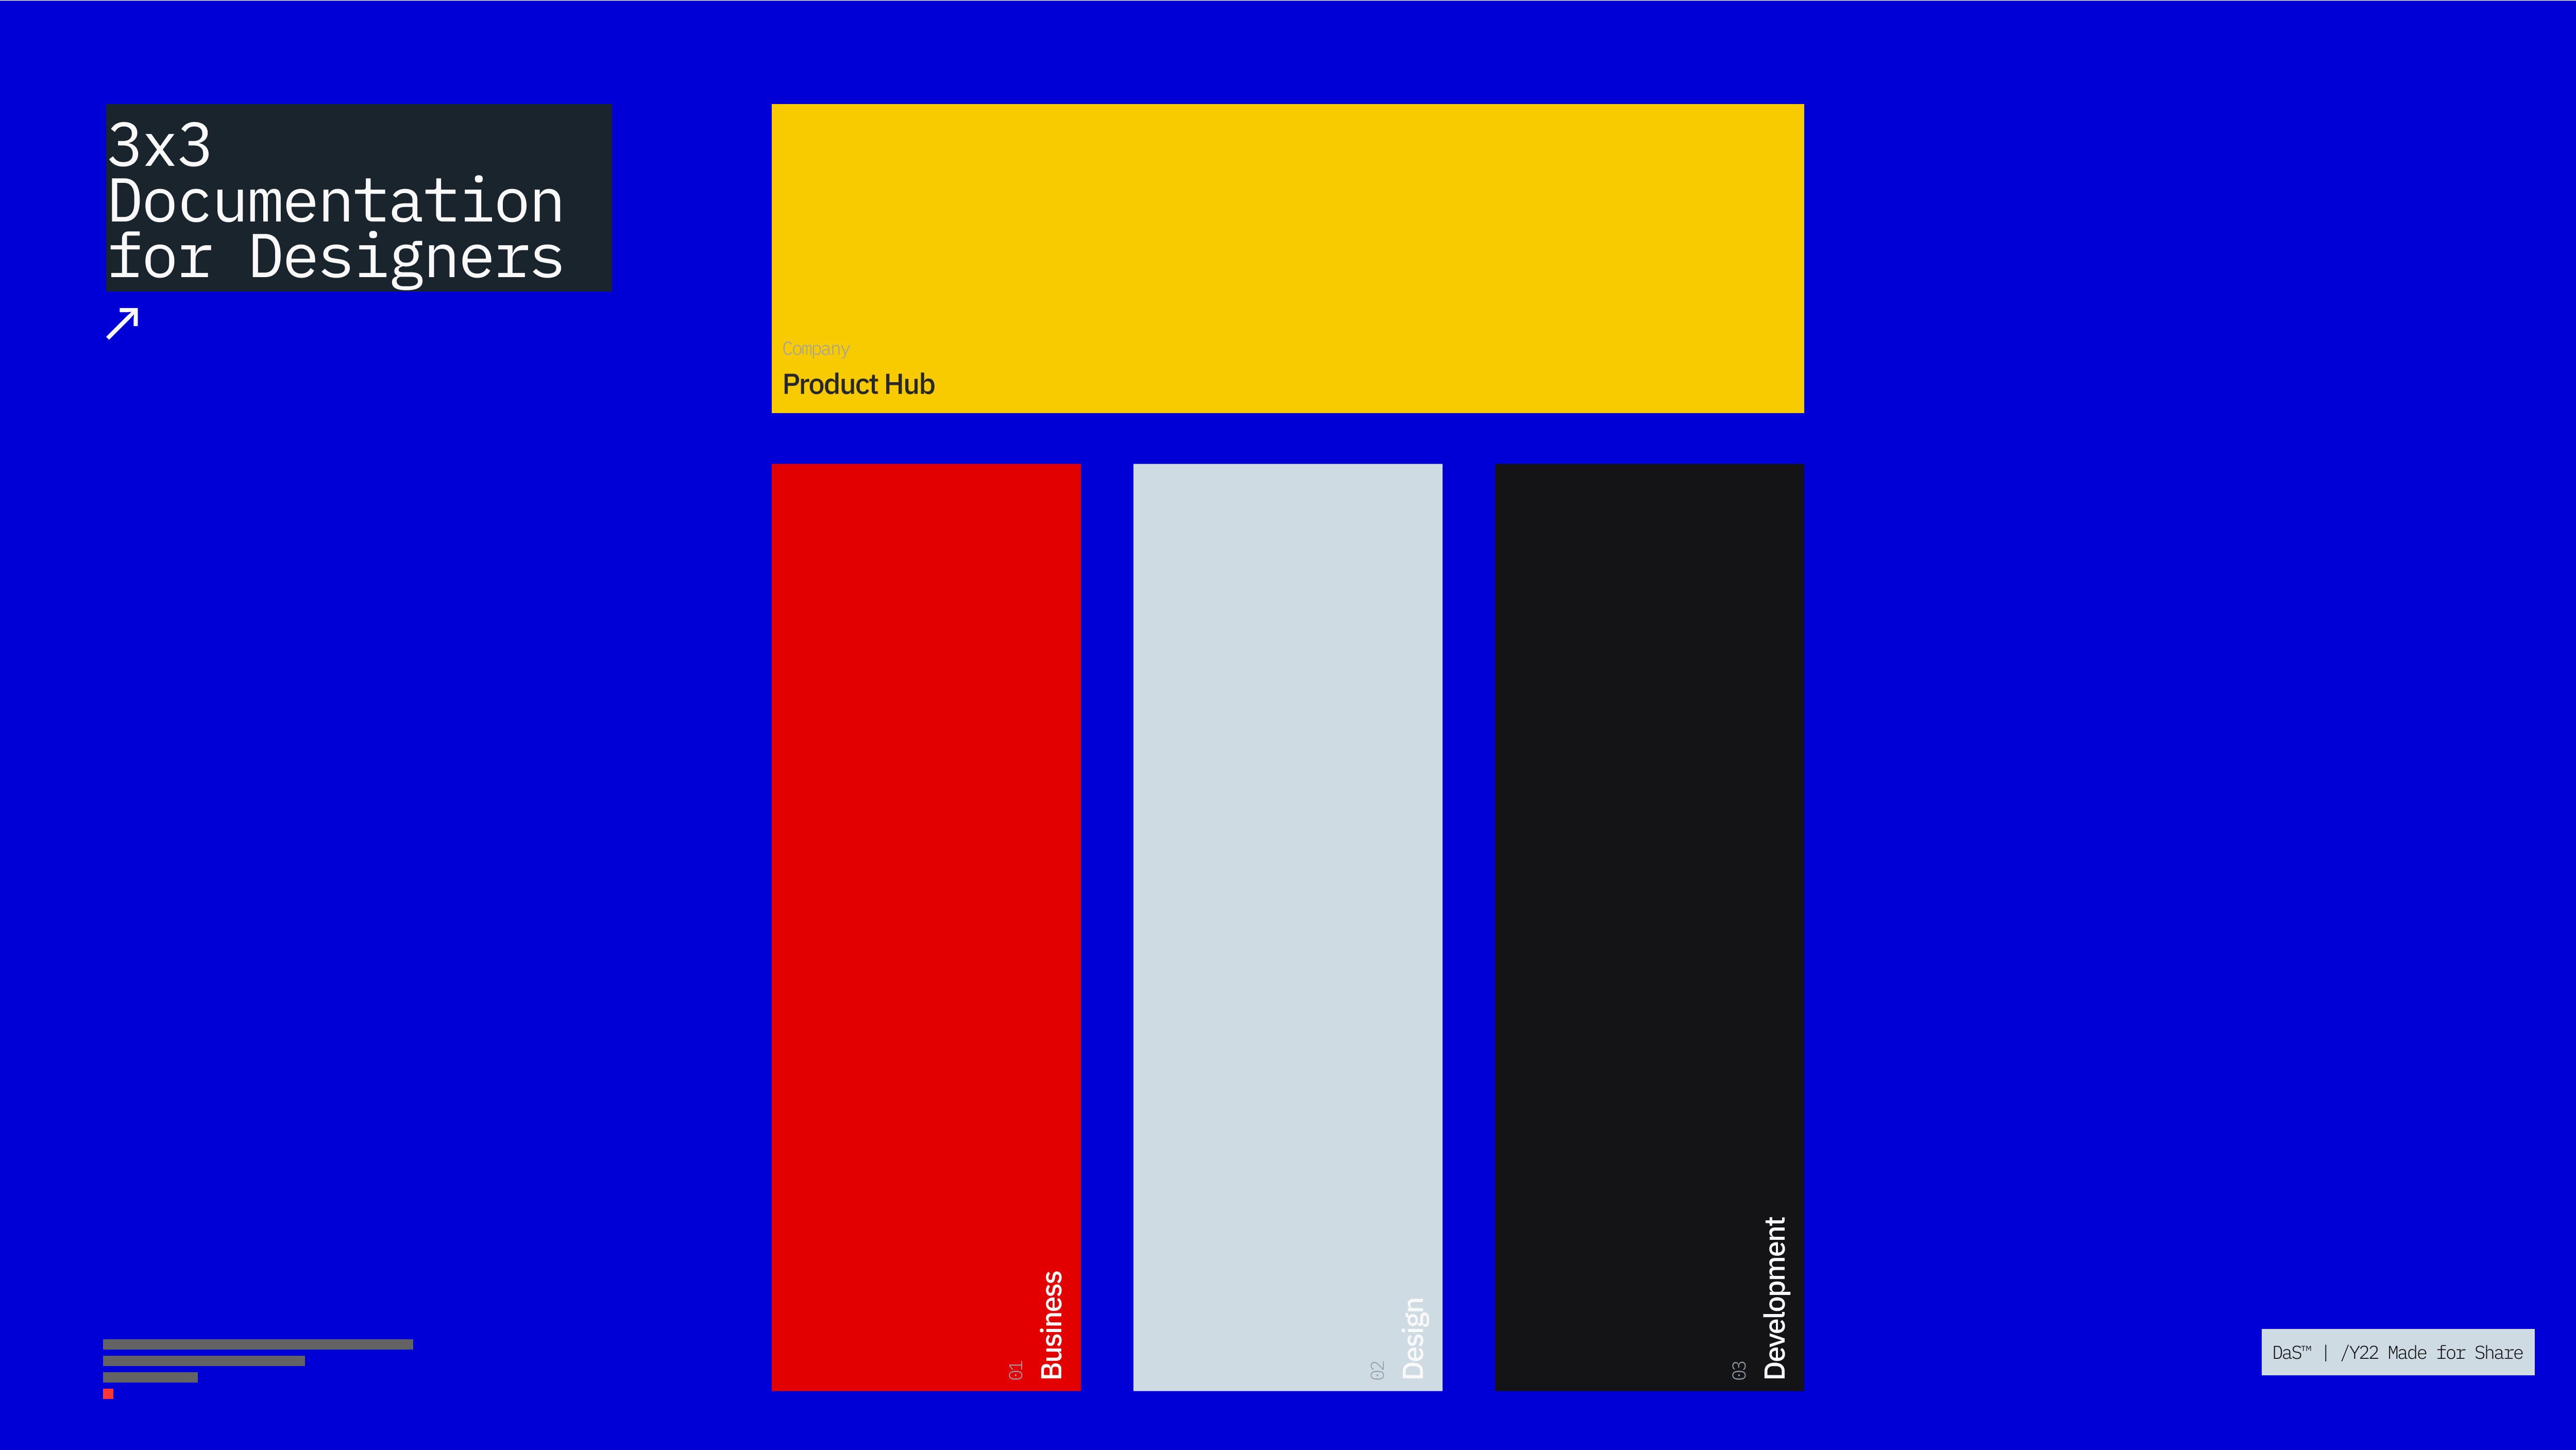
Welcome to the fourth article of the 3x3 series – Confluence for Designers looking at the communication structure for medium and large organisations to achieve transparency, which leads to frictionless and smooth design delivery.
This article will be closing the business pillar of three – Hello, Business and Research. The last section has the most significant impact on the design integration within the product team. This is where the business and the design glue objectives together under a well-researched and well-documented knowledge base that is accessible to the entire team 24/7.
No one would disagree that well-made decisions rely on well-informed teams or individuals. And that’s where the philosophy behind 3x3 starts to resonate in full.
“If a man does not know to what port he is steering, no wind is favourable to him.” – Seneca.
Having a great design and development team means nothing if neither one of them does not know where they are going and what problem they are trying to solve together. And that’s where the research team and this section come in and define a powerful relationship that ties the business proposal with design ambition and development capabilities into something that is:
- Achievable (Capabilities)
- Realistic (Business and Customer ROIs and OKRs)
- Measurable (based on realistic and measurable outcomes)
- Releasable (Coded and Tested)
The research section in confluence structure includes all customer and competitive landscape analyses. Once completed, we make the most valuable decision for the product. Each department is accountable for its own contribution.
As one CEO recently commented,
“No research and no understanding of the market means no right decision about direction and product itself”.
If there are no insights or initial landscape analysis, the product answer only the hypotheses of “what if” (unsure CEO) or better “I think” (dominant CEO), and both lead to more lavish spending, and waste of time and resources.

What does the research section do?
The research section offers a knowledge hub of competitive landscape analyses followed by behavioural and mental models of existing and prospective customers. It also contains the test of early-stage prototypes analysing the appetite for certain features or desired behaviour.
“How can we” (curios CEO) allow CPOs and their team to address specific challenges for the business or customer. This allows the having a unique lens for each problem and finding an appropriate solution to a very specific challenge.
You might probably ask, “all the analysis and every week testing, how do you structure it?” The same as business section automation plays a significant role in this hub. Over a decade of testing and implementation showed the balance between “documenting enough” (from the agile manifesto) more importantly “documenting what has an impact” (design at scale™ - reflects versioning, relevant data for design and dev sprints etc.). Several researchers confirmed that strengthening their knowledge of JIRA and Confluence serves well in applying their learnings directly to existing development. That’s why I became teaching JIRA and Confluence for designers, and that is where I gathered a substantial amount of feedback from the design and research colleagues that make this structure resilient.

The research section does not.
As you can imagine, this clarity took a while; most businesses and corporations were afraid to let it go, the PPTX and Words and Excels from their own systems to really see the power of an integrated function of Confluence with JIRA in real product design development. Equally, the researchers who were fantastic with interviews and customers were not so tech-savvy with the technology – our design courses change that.
Even this section was a damp yard of almost 3000-word documents with different names, a person who did the interview not clear or fluctuating objectives for the research, legal management of the research data and so on. Not even mention the fact when the research was handed over from person to person, no one knew what was the action to take “what we have learned.”
Once the team invested the time in standardising these 3000-word documents, Confluence automation tools make this task really easy, engaging and quite fun for both designers and researchers. While our knowledge grew, and our impact strengthened as we started linking our findings directly to an Epic and User Stories. Suddenly our developers knew why they do what they do – it was not a change forced by the CEO or CPO it was a well-researched and documented reason for improving the product. And that’s where the dynamic of responsibility changed to accountability.
From that day onwards development team required the research to be linked directly to their task – it meant that the User story went through the evaluation and the team is making the decision on real data and not on someones feeling – a practical example can be found as part of the DaS™ Courses.
For more information, please join the Design at Scale™ Courses that explain the function, impact, and common pitfalls that can be avoided while implementing the DaS™ in your business.

Structure
Let’s look at the Confluence structure in detail:
Business
1.0 — BRAND* Hello
2.0 — BRAND* Business
3.0 — BRAND* Research
Design
4.0 — BRAND* Content
5.0 — BRAND* Experience
6.0 — BRAND* Design
Development
7.0 — BRAND* Development
8.0 — BRAND* Releases
9.0 — BRAND* Integrations